

For the Continuous Improvement (CI) Manager
Stop chasing data. Start improving what really matters
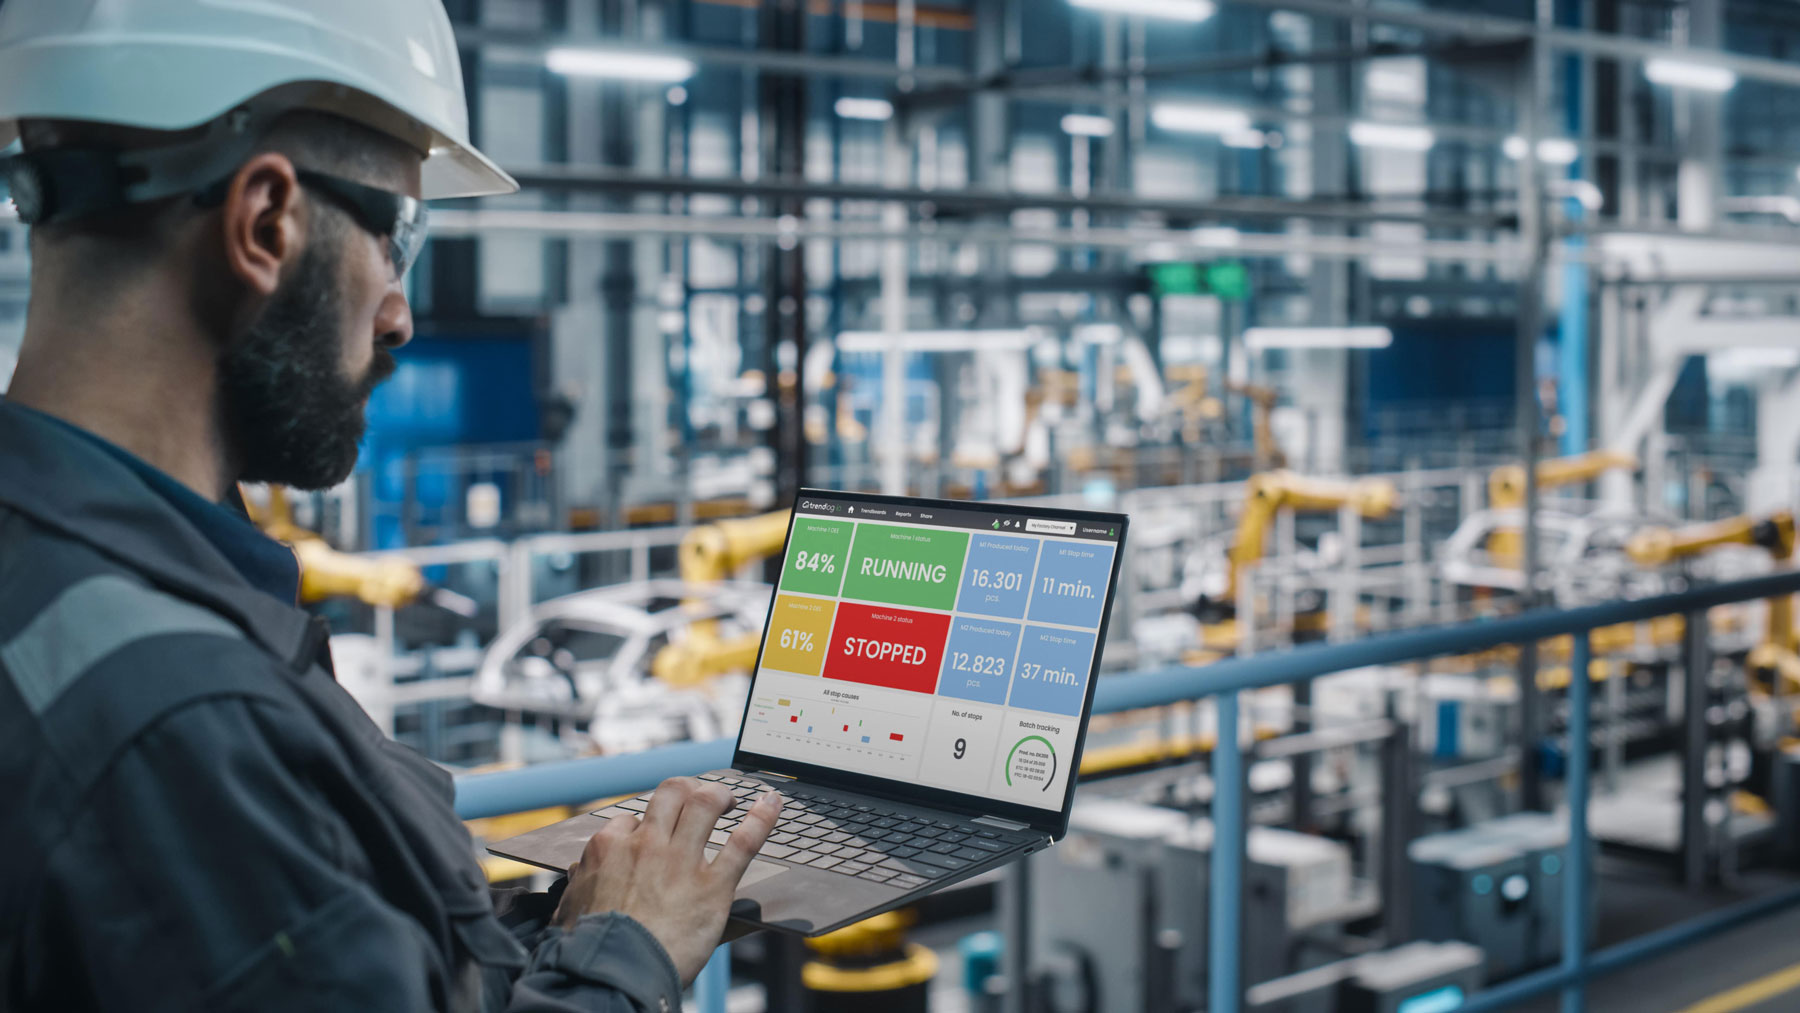
Have you ever been in these situations?
You can't make cross-comparisons because the data isn't the same
Improvement measures are decided based on gut feelings, not facts
You never really know if an improvement worked
How to Build a Solid Foundation for Your CI Work
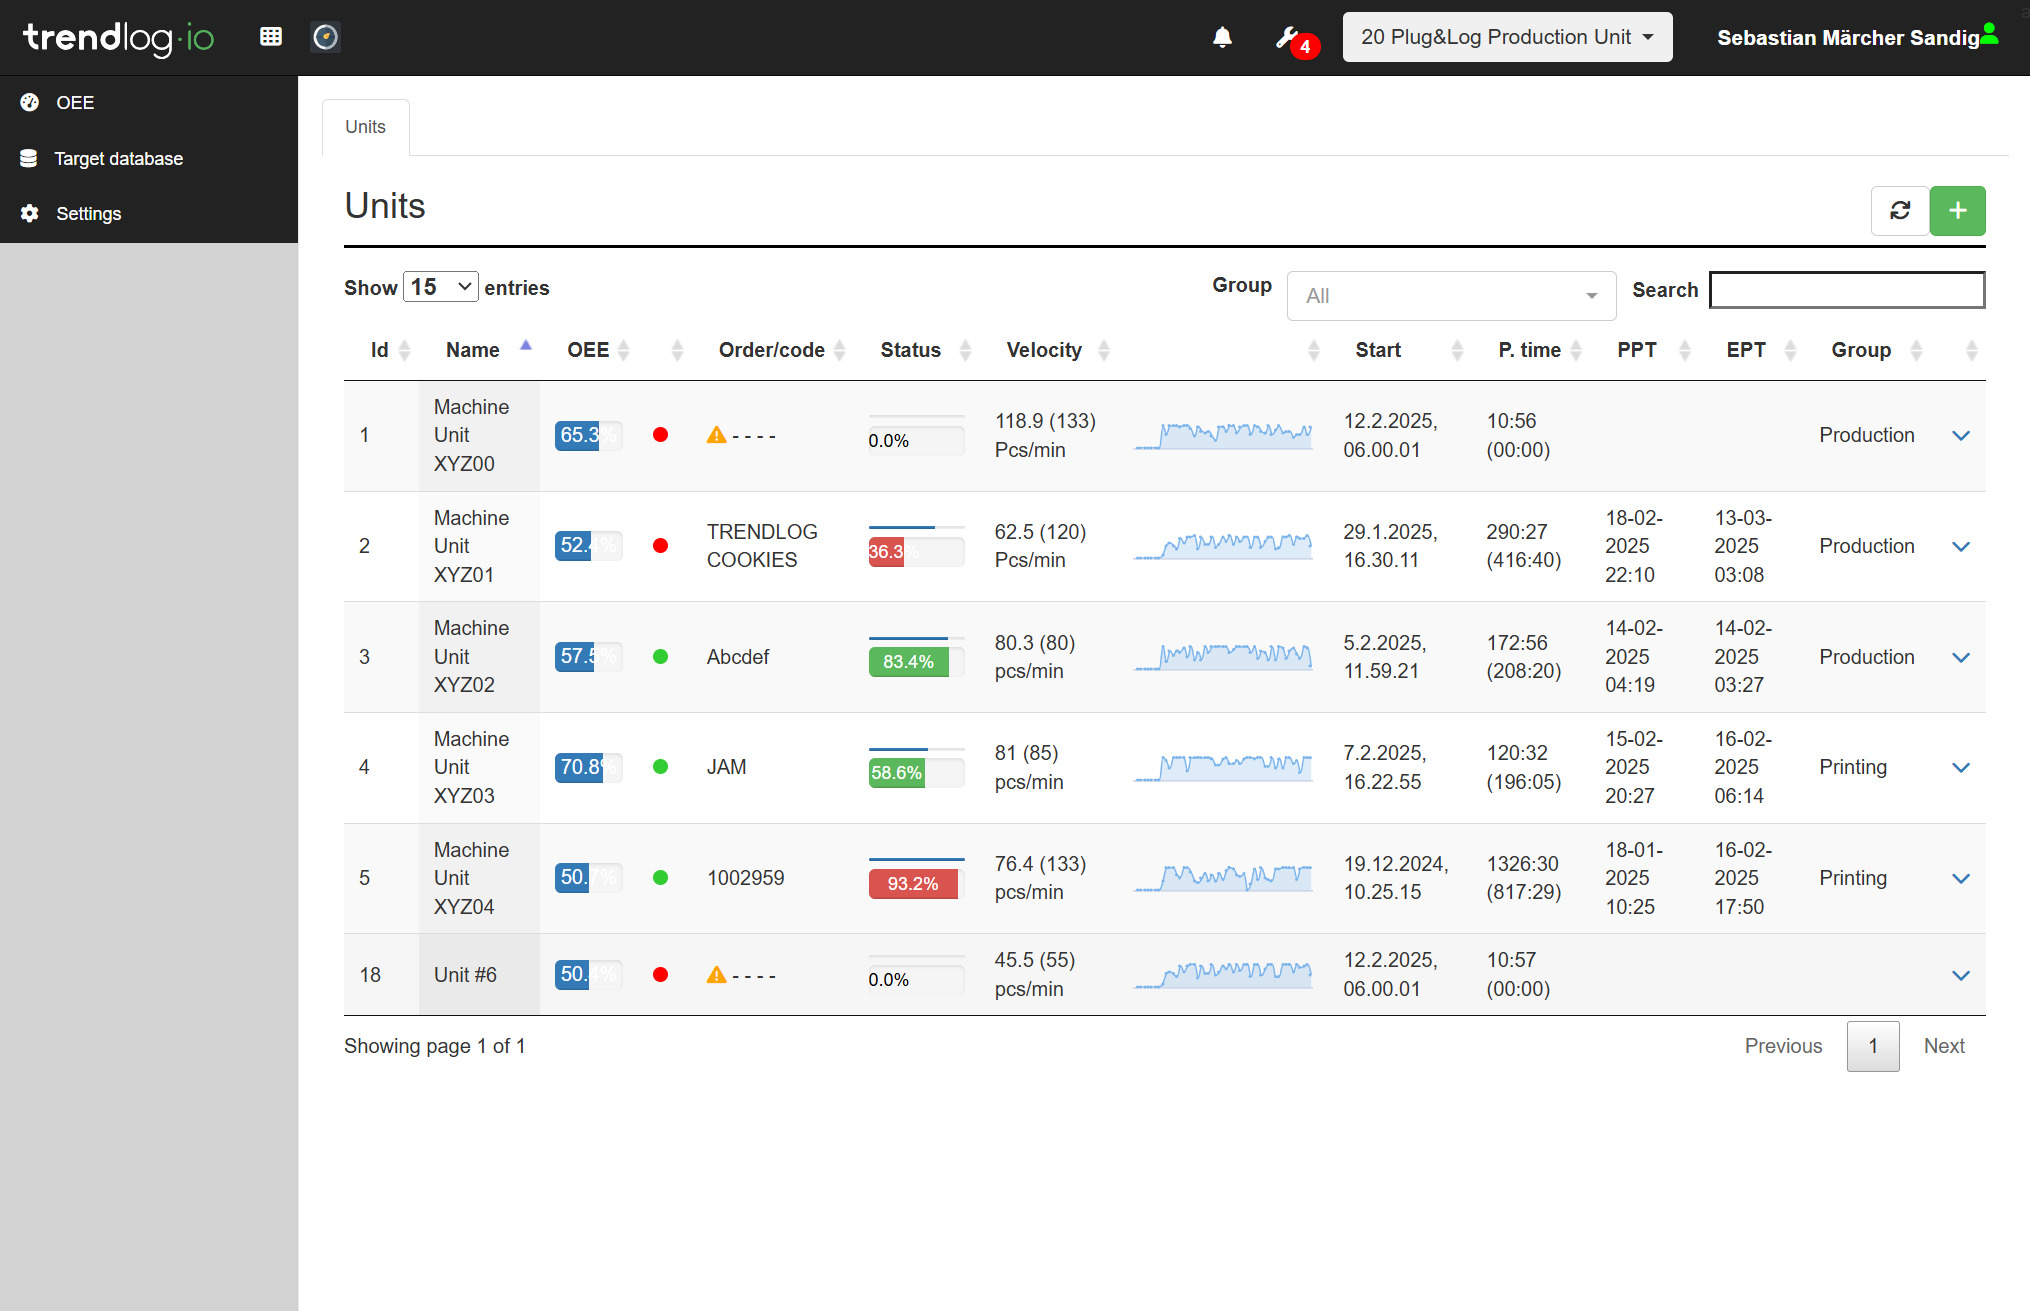
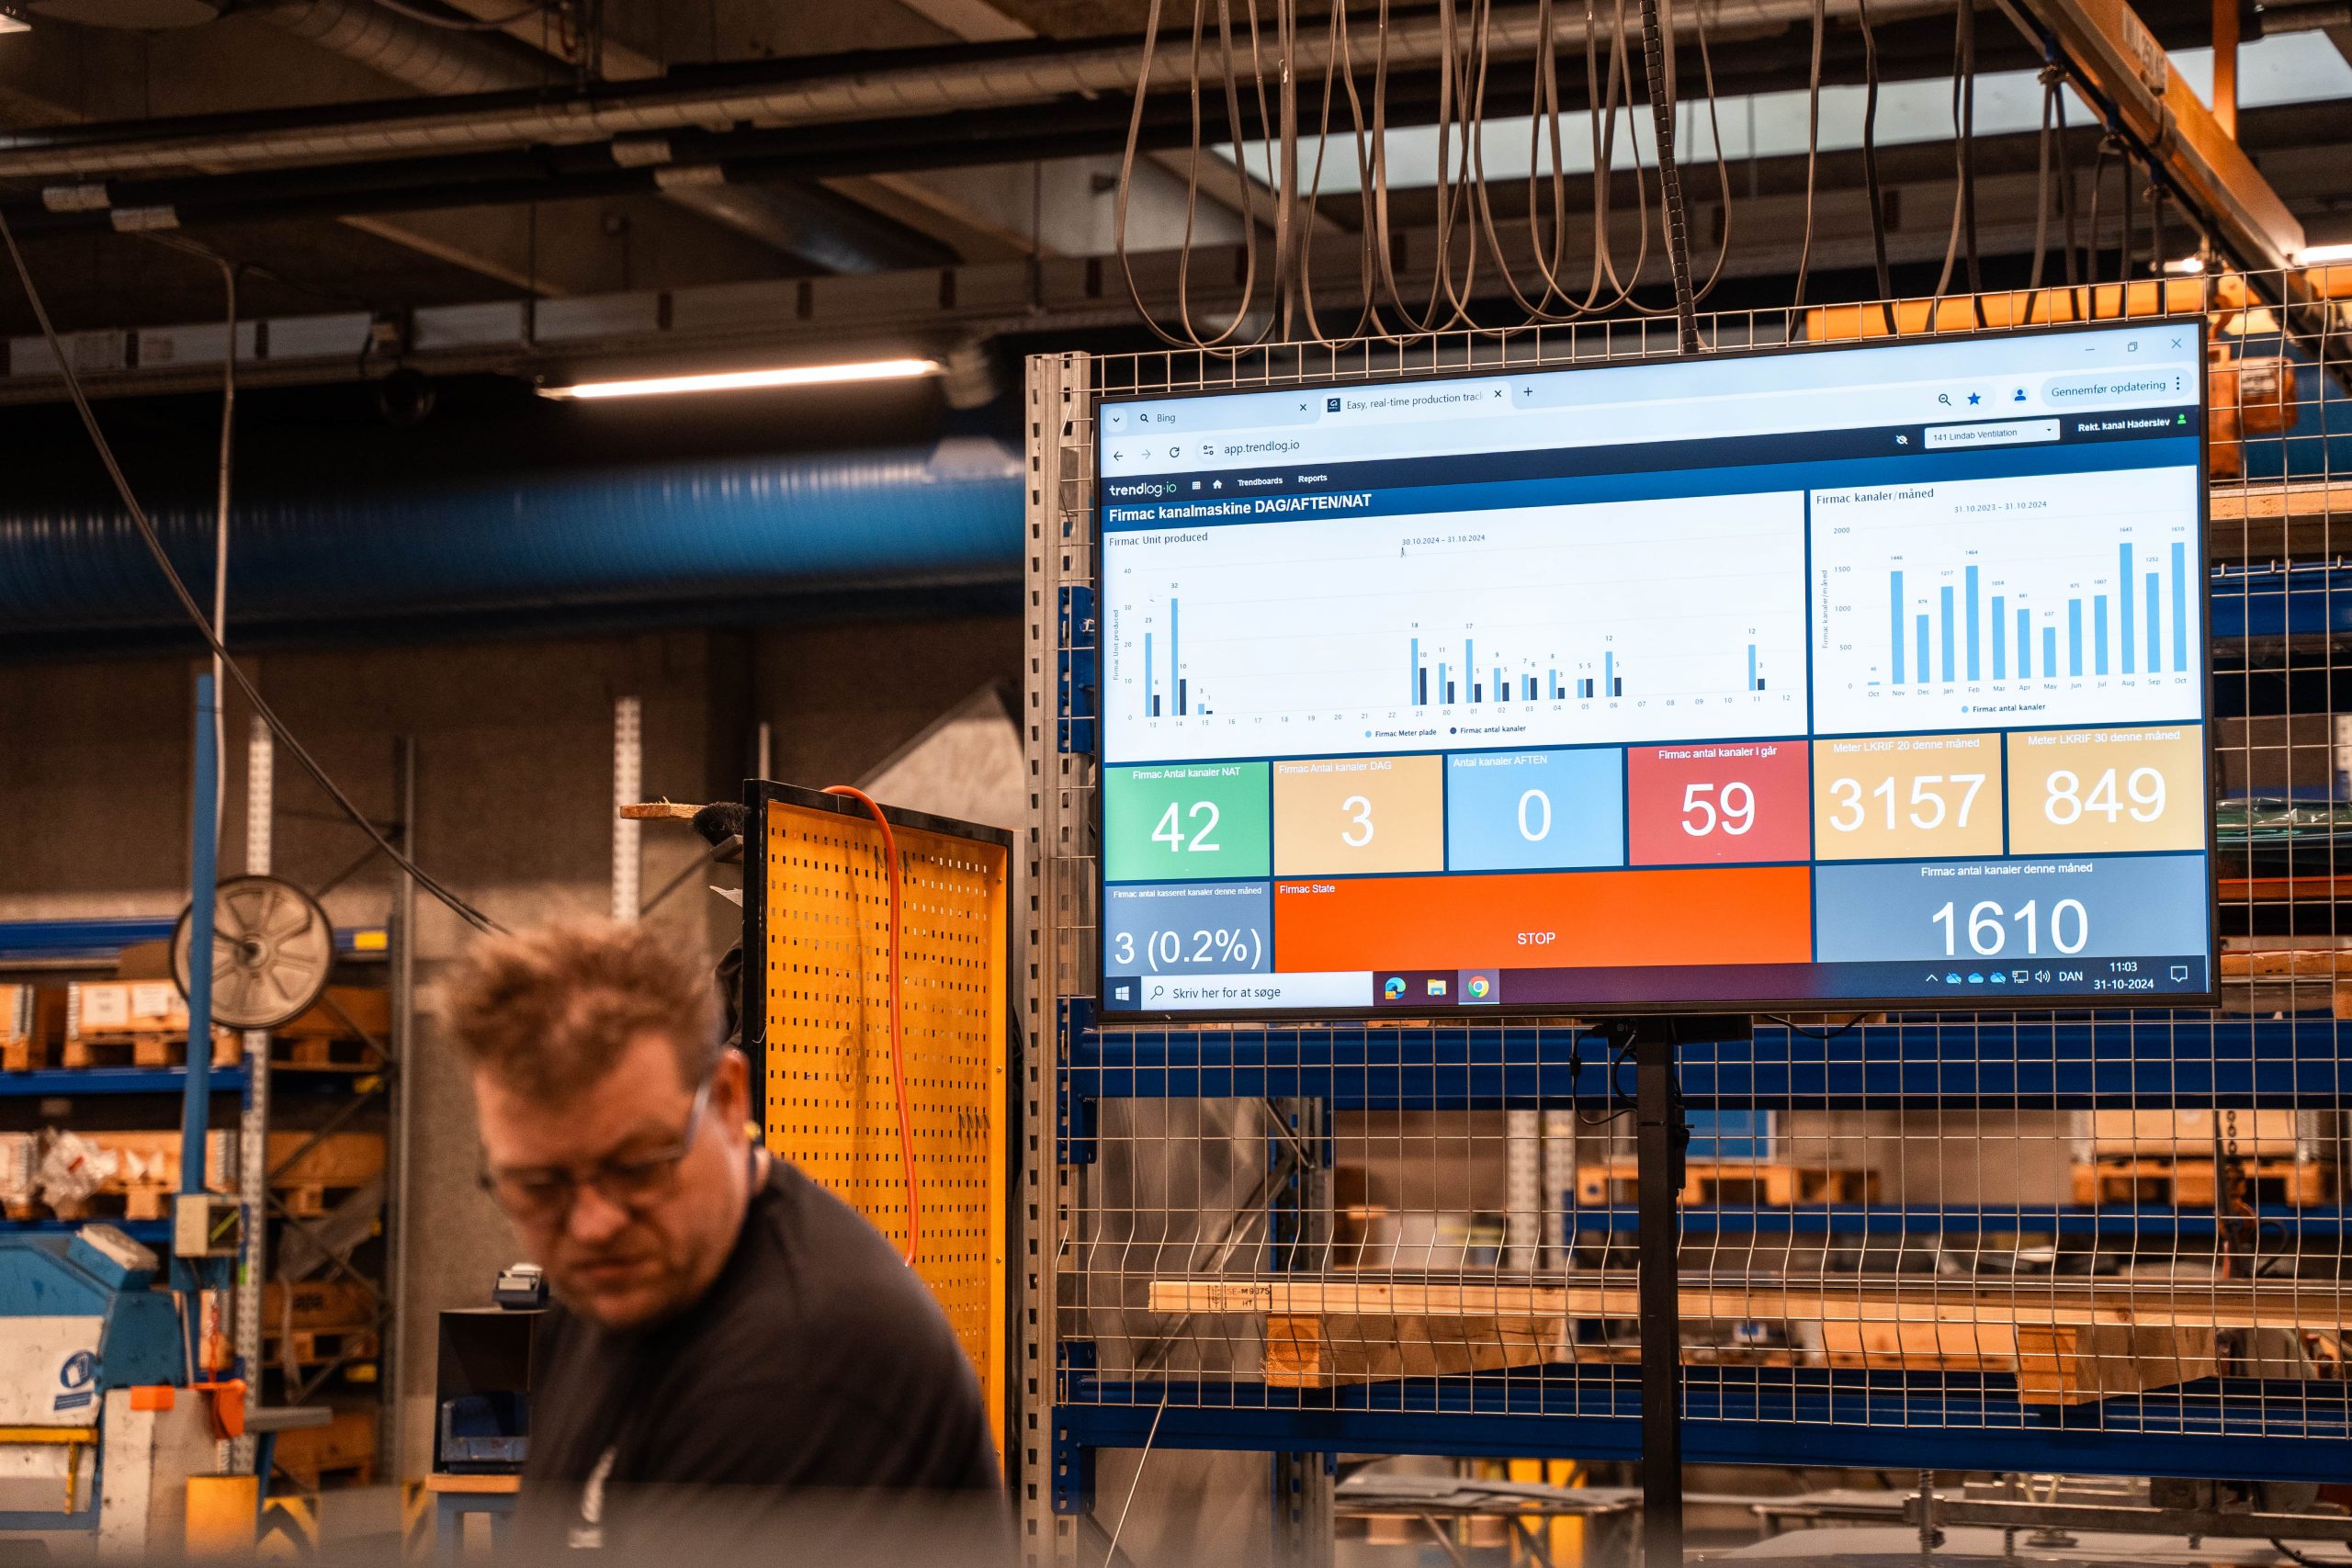
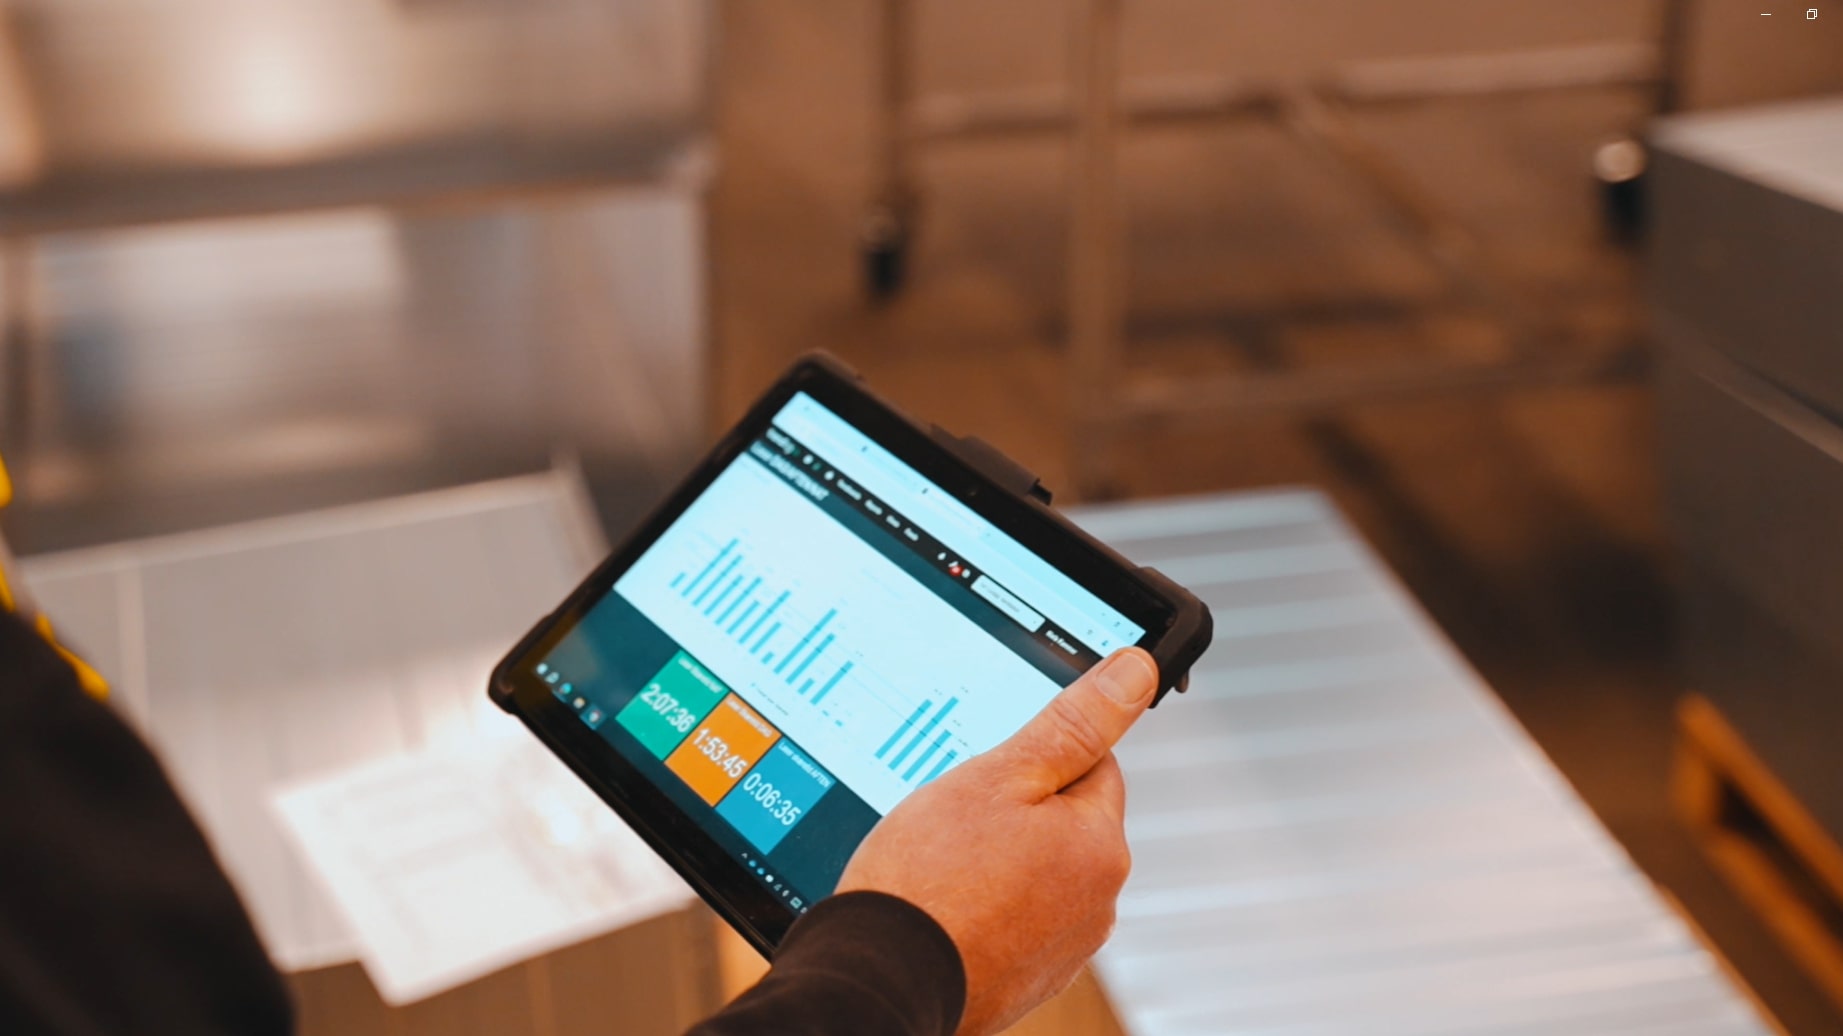
TrendOEE
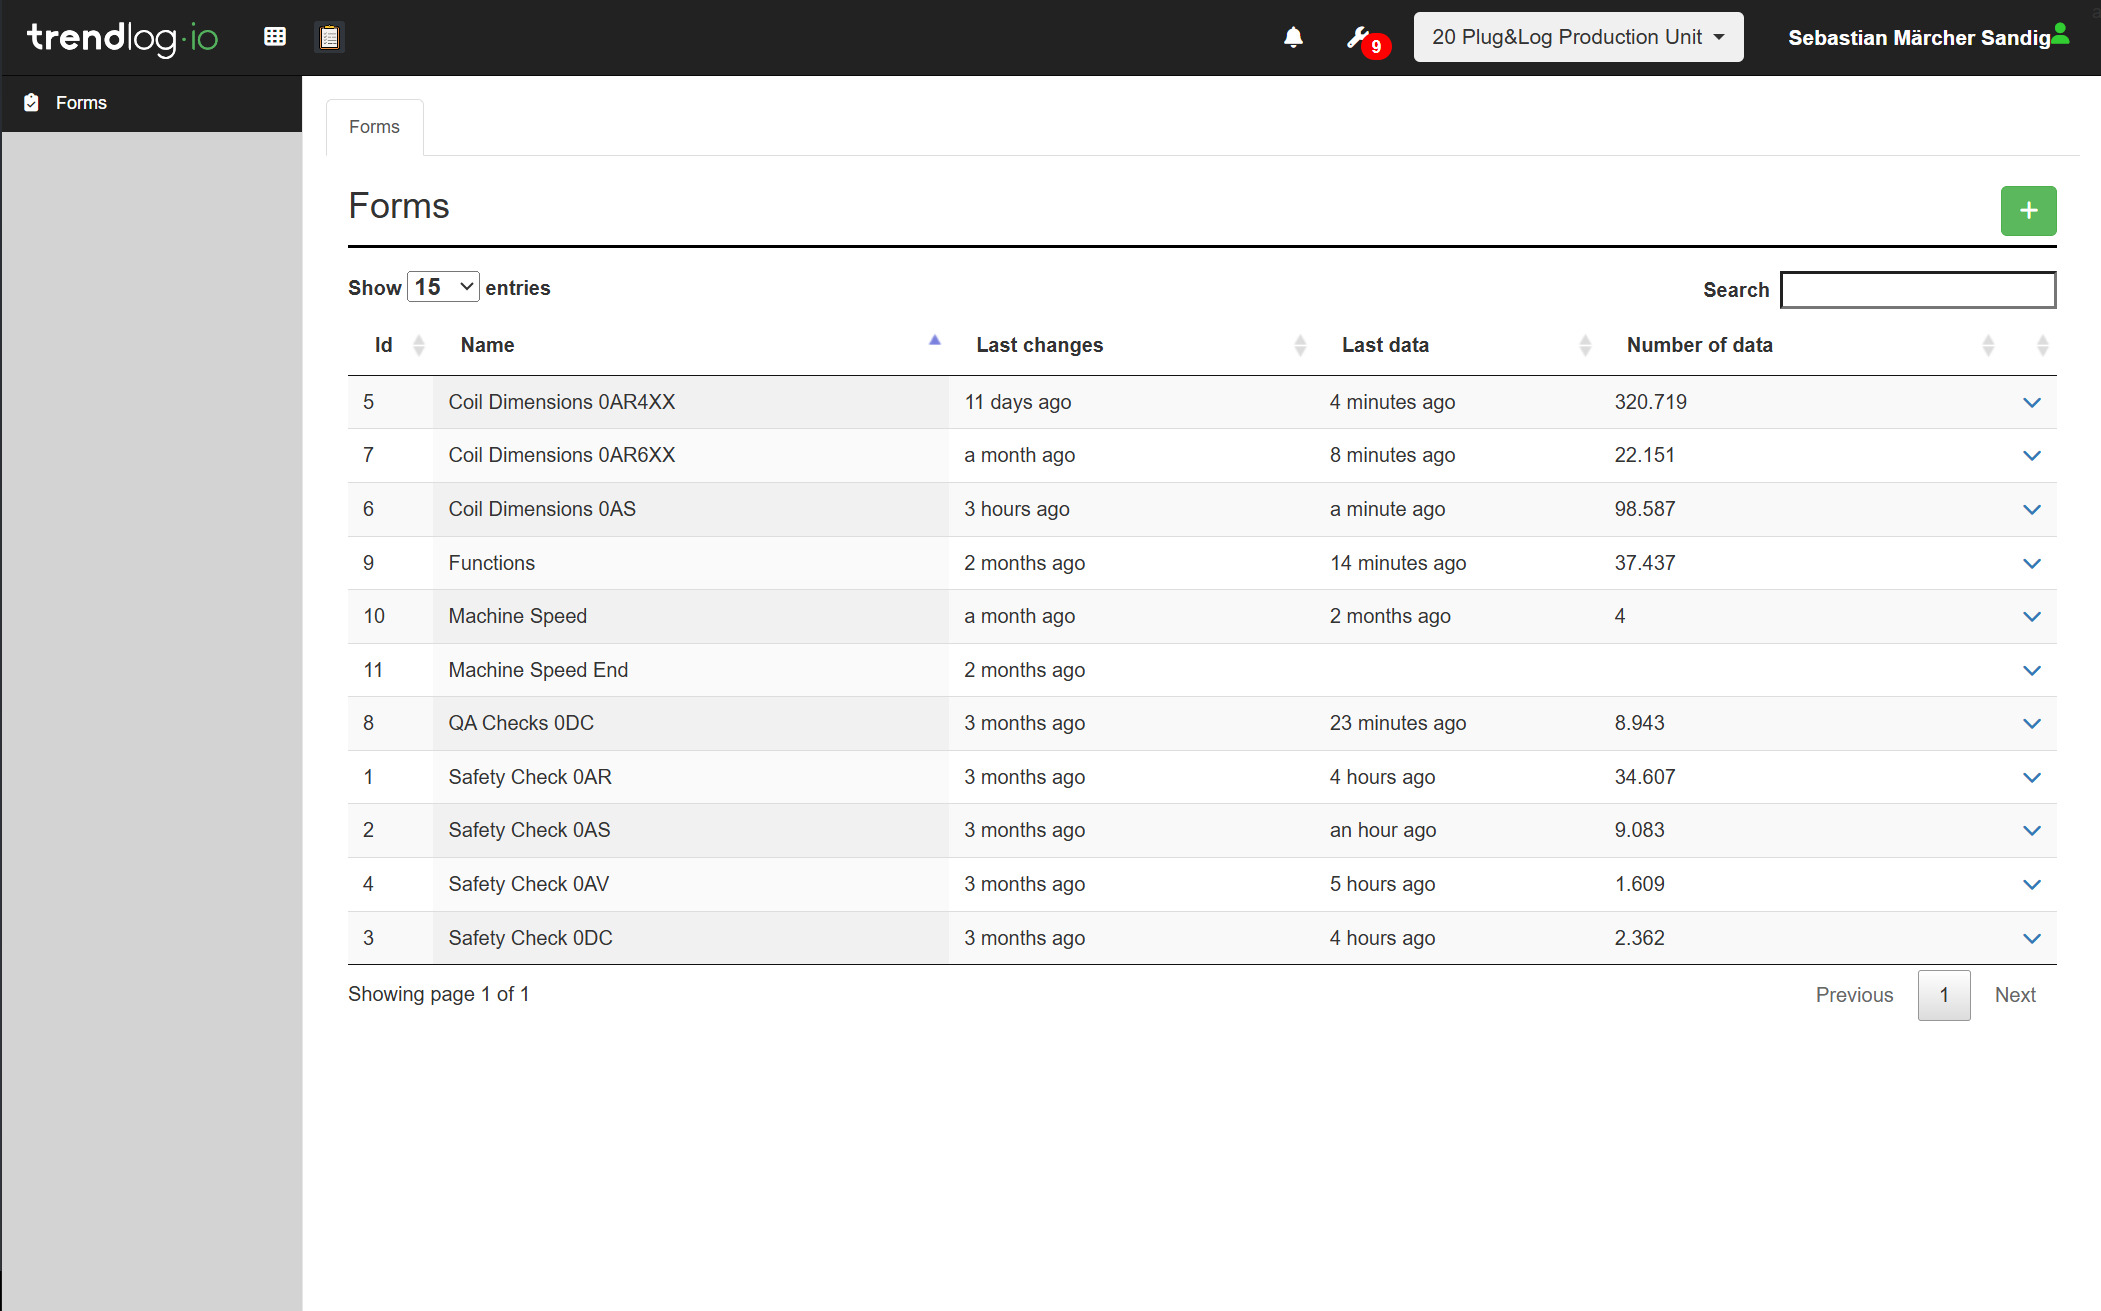
TrendFORMS
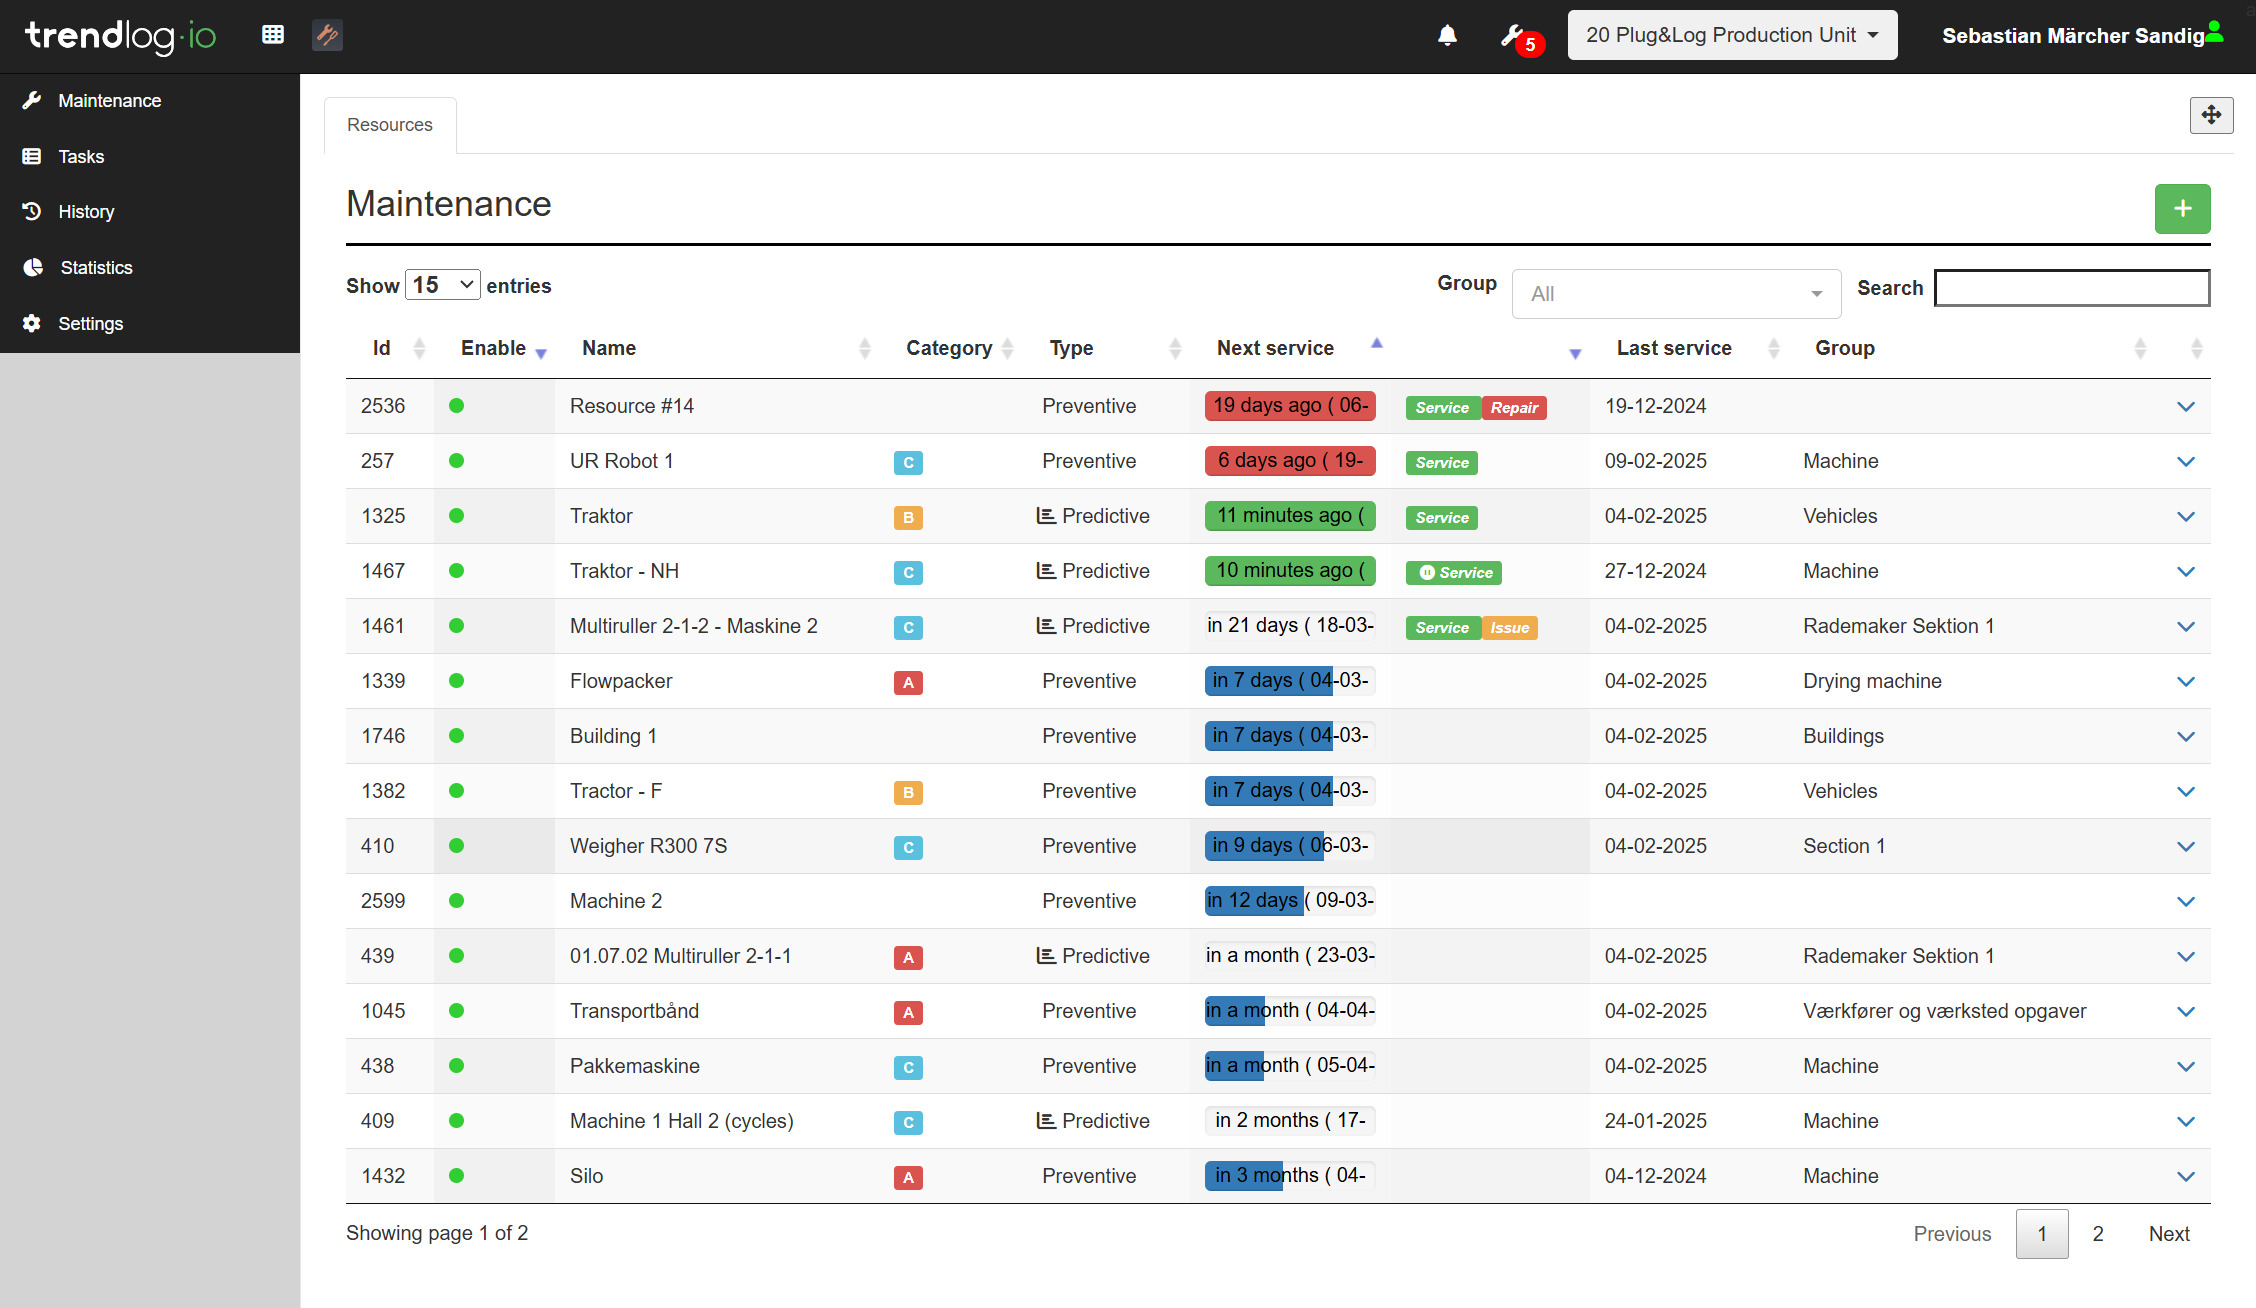
MaintenancePLANNER
CALCULATE YOUR POTENTIAL
How much capacity is hidden in your OEE?
Micro-stops, startup waste, changeovers — these are often what eat away at your capacity without showing up on the books. Try our calculator and get an indication of what systematic OEE efforts could be worth to you. It takes less than a minute. The calculator is based on industry benchmarks and uses your own operational data to make the estimate. You will receive both your overall potential and a breakdown across four specific areas of improvement.
How much capacity is hidden in your machines?
In under 60 seconds, get an estimate based on your operations and industry benchmarks.
What industry are you in?
Selects your industry profile and pre-fills the next fields.
What does your operation look like?
We've set realistic defaults — adjust them if they don't fit.
How large is your production?
We use size to estimate your throughput and margin per unit.
How advanced is your OEE practice today?
Gut feeling is fine — it's just to estimate your starting point.
Systematic OEE work could be worth
Micro-stops and speed losses are often the largest hidden loss. Small stops of 30–60 seconds get treated as "normal operation" but can amount to 5–15% of available time.
Startup waste after order changeovers is rarely quantified. The first 30–60 minutes of a new order often run at 60–80% of nominal speed until settings and operator rhythm settle in.
Stop causes only become visible when you start measuring. Many know 5–6 typical stops but find 20–30 different ones in the data — and those are exactly the ones you can address systematically.
We've used your numbers and estimated the rest from industry benchmarks:
This is an indicative estimate based on industry benchmarks — not a precise assessment. It assumes that the freed capacity can be sold, or that it replaces equivalent overtime or postponed investments. Book a live demo for a precise calculation based on your own numbers.
Get a precise assessment — book a demo →Standards & Documentation of Improvements
CI in a Certified Environment — Document What Works
Trendlog makes CI documentation a natural part of operations: deviations are recorded in TrendFORMS, root causes are linked to downtime data in TrendOEE, and improvement initiatives can be tracked over time. Together, this provides a strong documentation foundation for your continuous improvement efforts—regardless of which standard you’re working under, and without any extra work when the auditor arrives.
Frequently Asked Questions
How do you ensure that reasons for stopping are recorded consistently across shifts?
Can Trendlog support Lean and Six Sigma?
What are MTBF and MTTR, and how are they calculated?
Can I create my own forms and checklists?
A culture of improvement built on a single, shared dataset
With Trendlog Production Suite, this data is consolidated on a single platform. Your Pareto analysis draws on real, consistent production data. Your PDCA documentation is naturally linked to the records that triggered the improvement initiative. And you can show management—with data—that the improvement efforts have a measurable impact. That’s the difference between a culture of improvement that feels right and one that can be proven.
Start with the module that addresses your biggest CI challenge. Build on that.
More from Trendlog
5 tips to streamline the data across the production plant
There are many ways, from which manufacturers can harvest value from their data. But in a production plant with manual paperwork, surprises can…
Midsona optimized their production by 20%
Is it possible to improve efficiency just by measuring data? Yes, is the short answer from Midsona. In fact, they registered an improvement in OEE…
How do you digitize in your production?
In today’s fast-paced manufacturing landscape, data has become the lifeblood of efficient and competitive production…