

For the Production Manager
Get an overview of your production—in real time, across lines and departments
Stop searching for answers in three different systems. Get a single place that shows you what’s actually happening on the shop floor—while you still have time to take action.

Have you ever been in these situations?
You know there's a loss in production—but you don't know exactly how much, or why.
The figures are coming in too late, are based on gut feelings from the last shift meeting, or aren’t even compiled in one place.
When something goes wrong, the production and technical departments point fingers at each other.
Was it a machine malfunction that should have been prevented—or an operational error? Without shared data, this will remain a discussion rather than a decision.
You spend more time looking for information than acting on it.
Excel spreadsheets, paper forms, and various systems that don’t communicate with each other mean that, as a manager, you have the pieces but not the full picture.
How to Keep Track of Production with Trendlog
You don’t have to implement an entire system all at once. Start with the module that solves your biggest problem—and expand as it makes sense. What ties it all together is that the modules share the same data foundation, so you don’t have to piece together bits and pieces from different vendors that don’t communicate with each other.
From backward-looking reports to real-time insights
TrendOEE
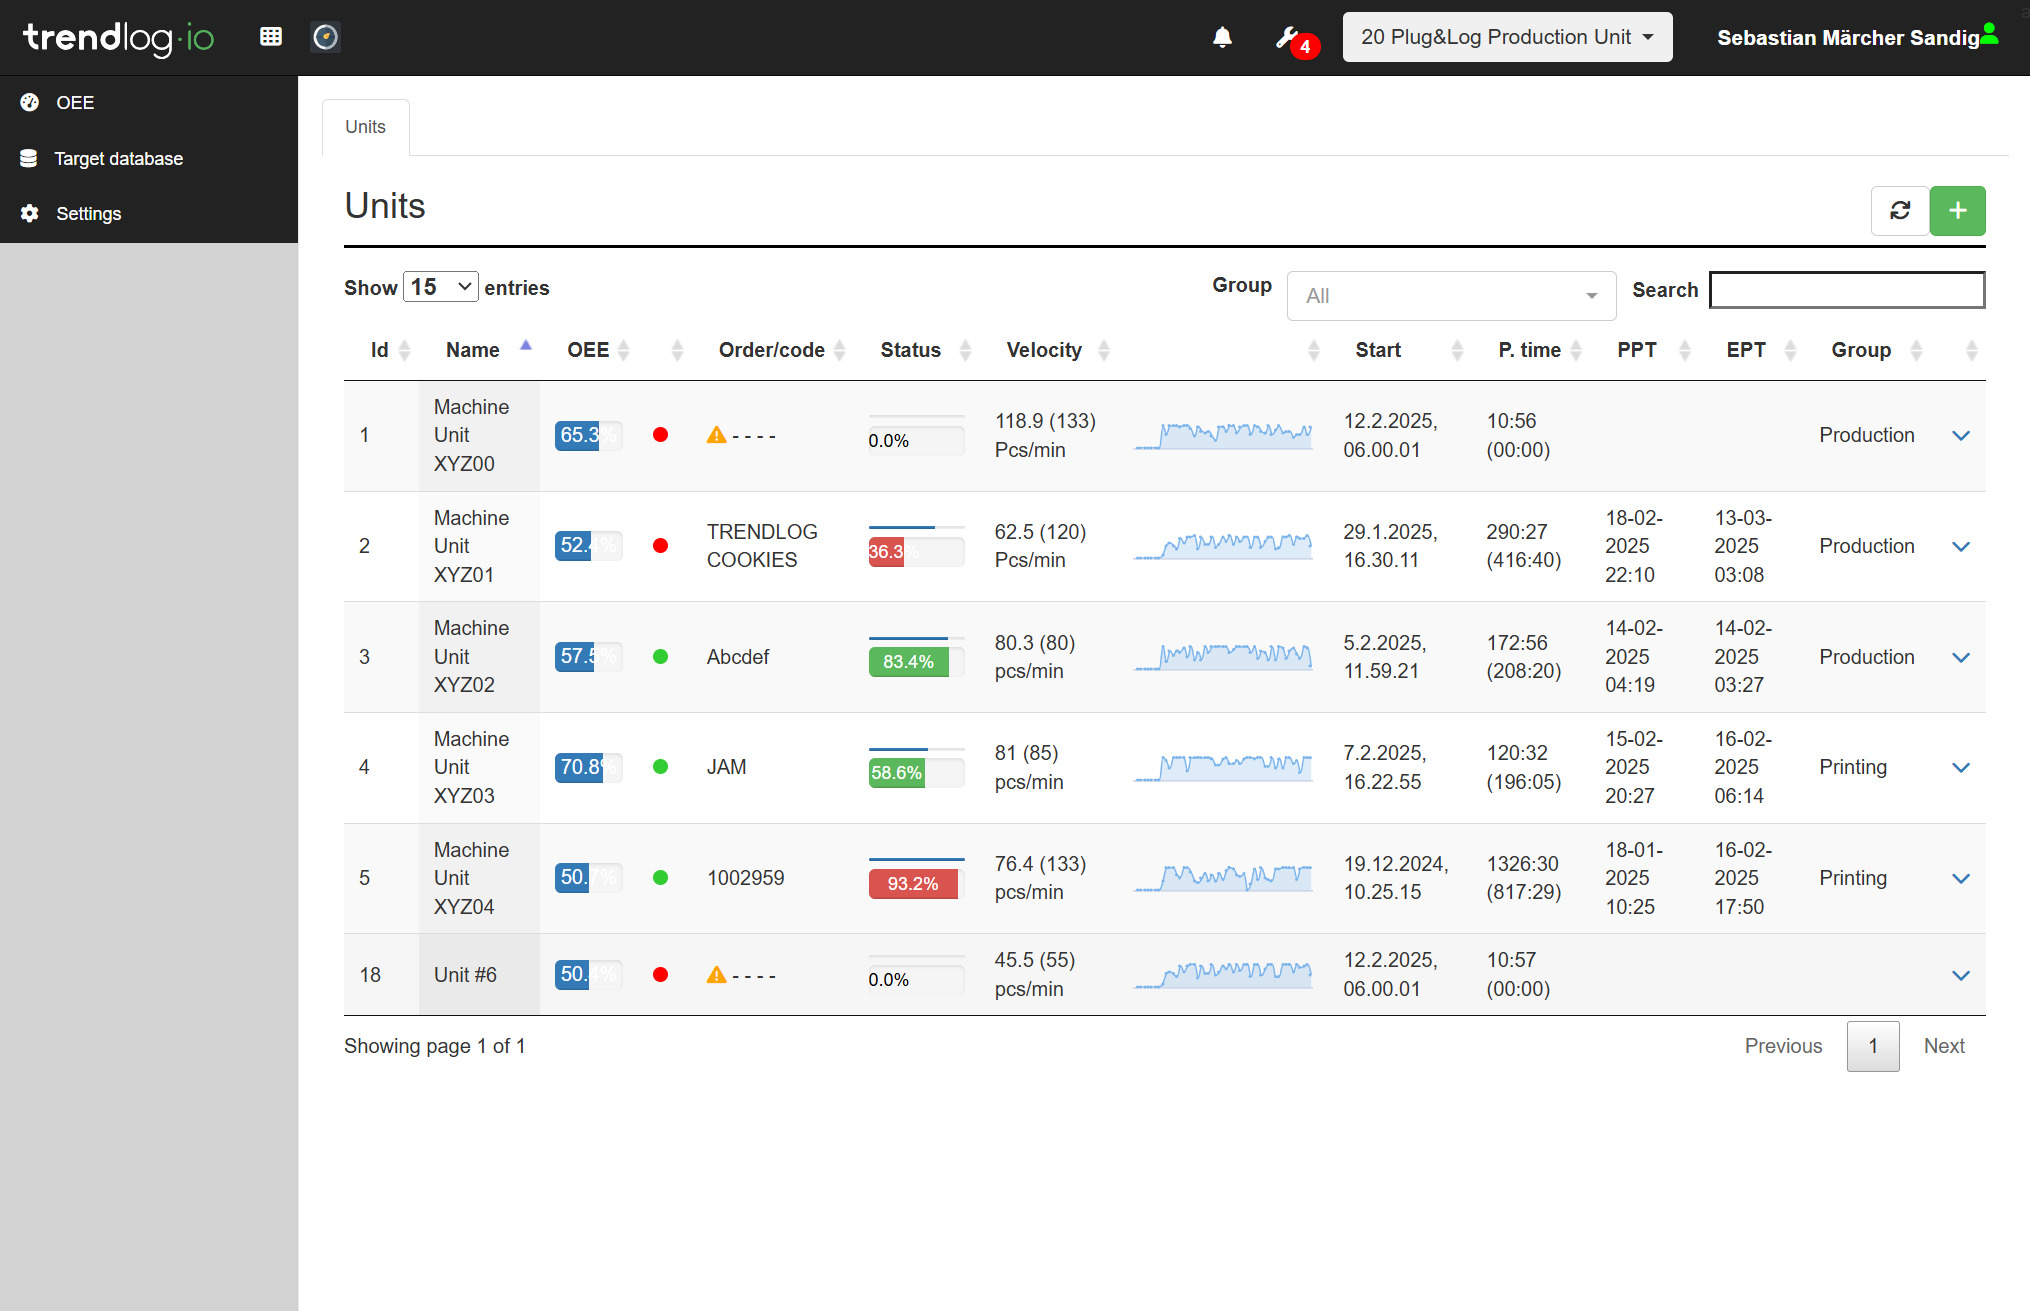
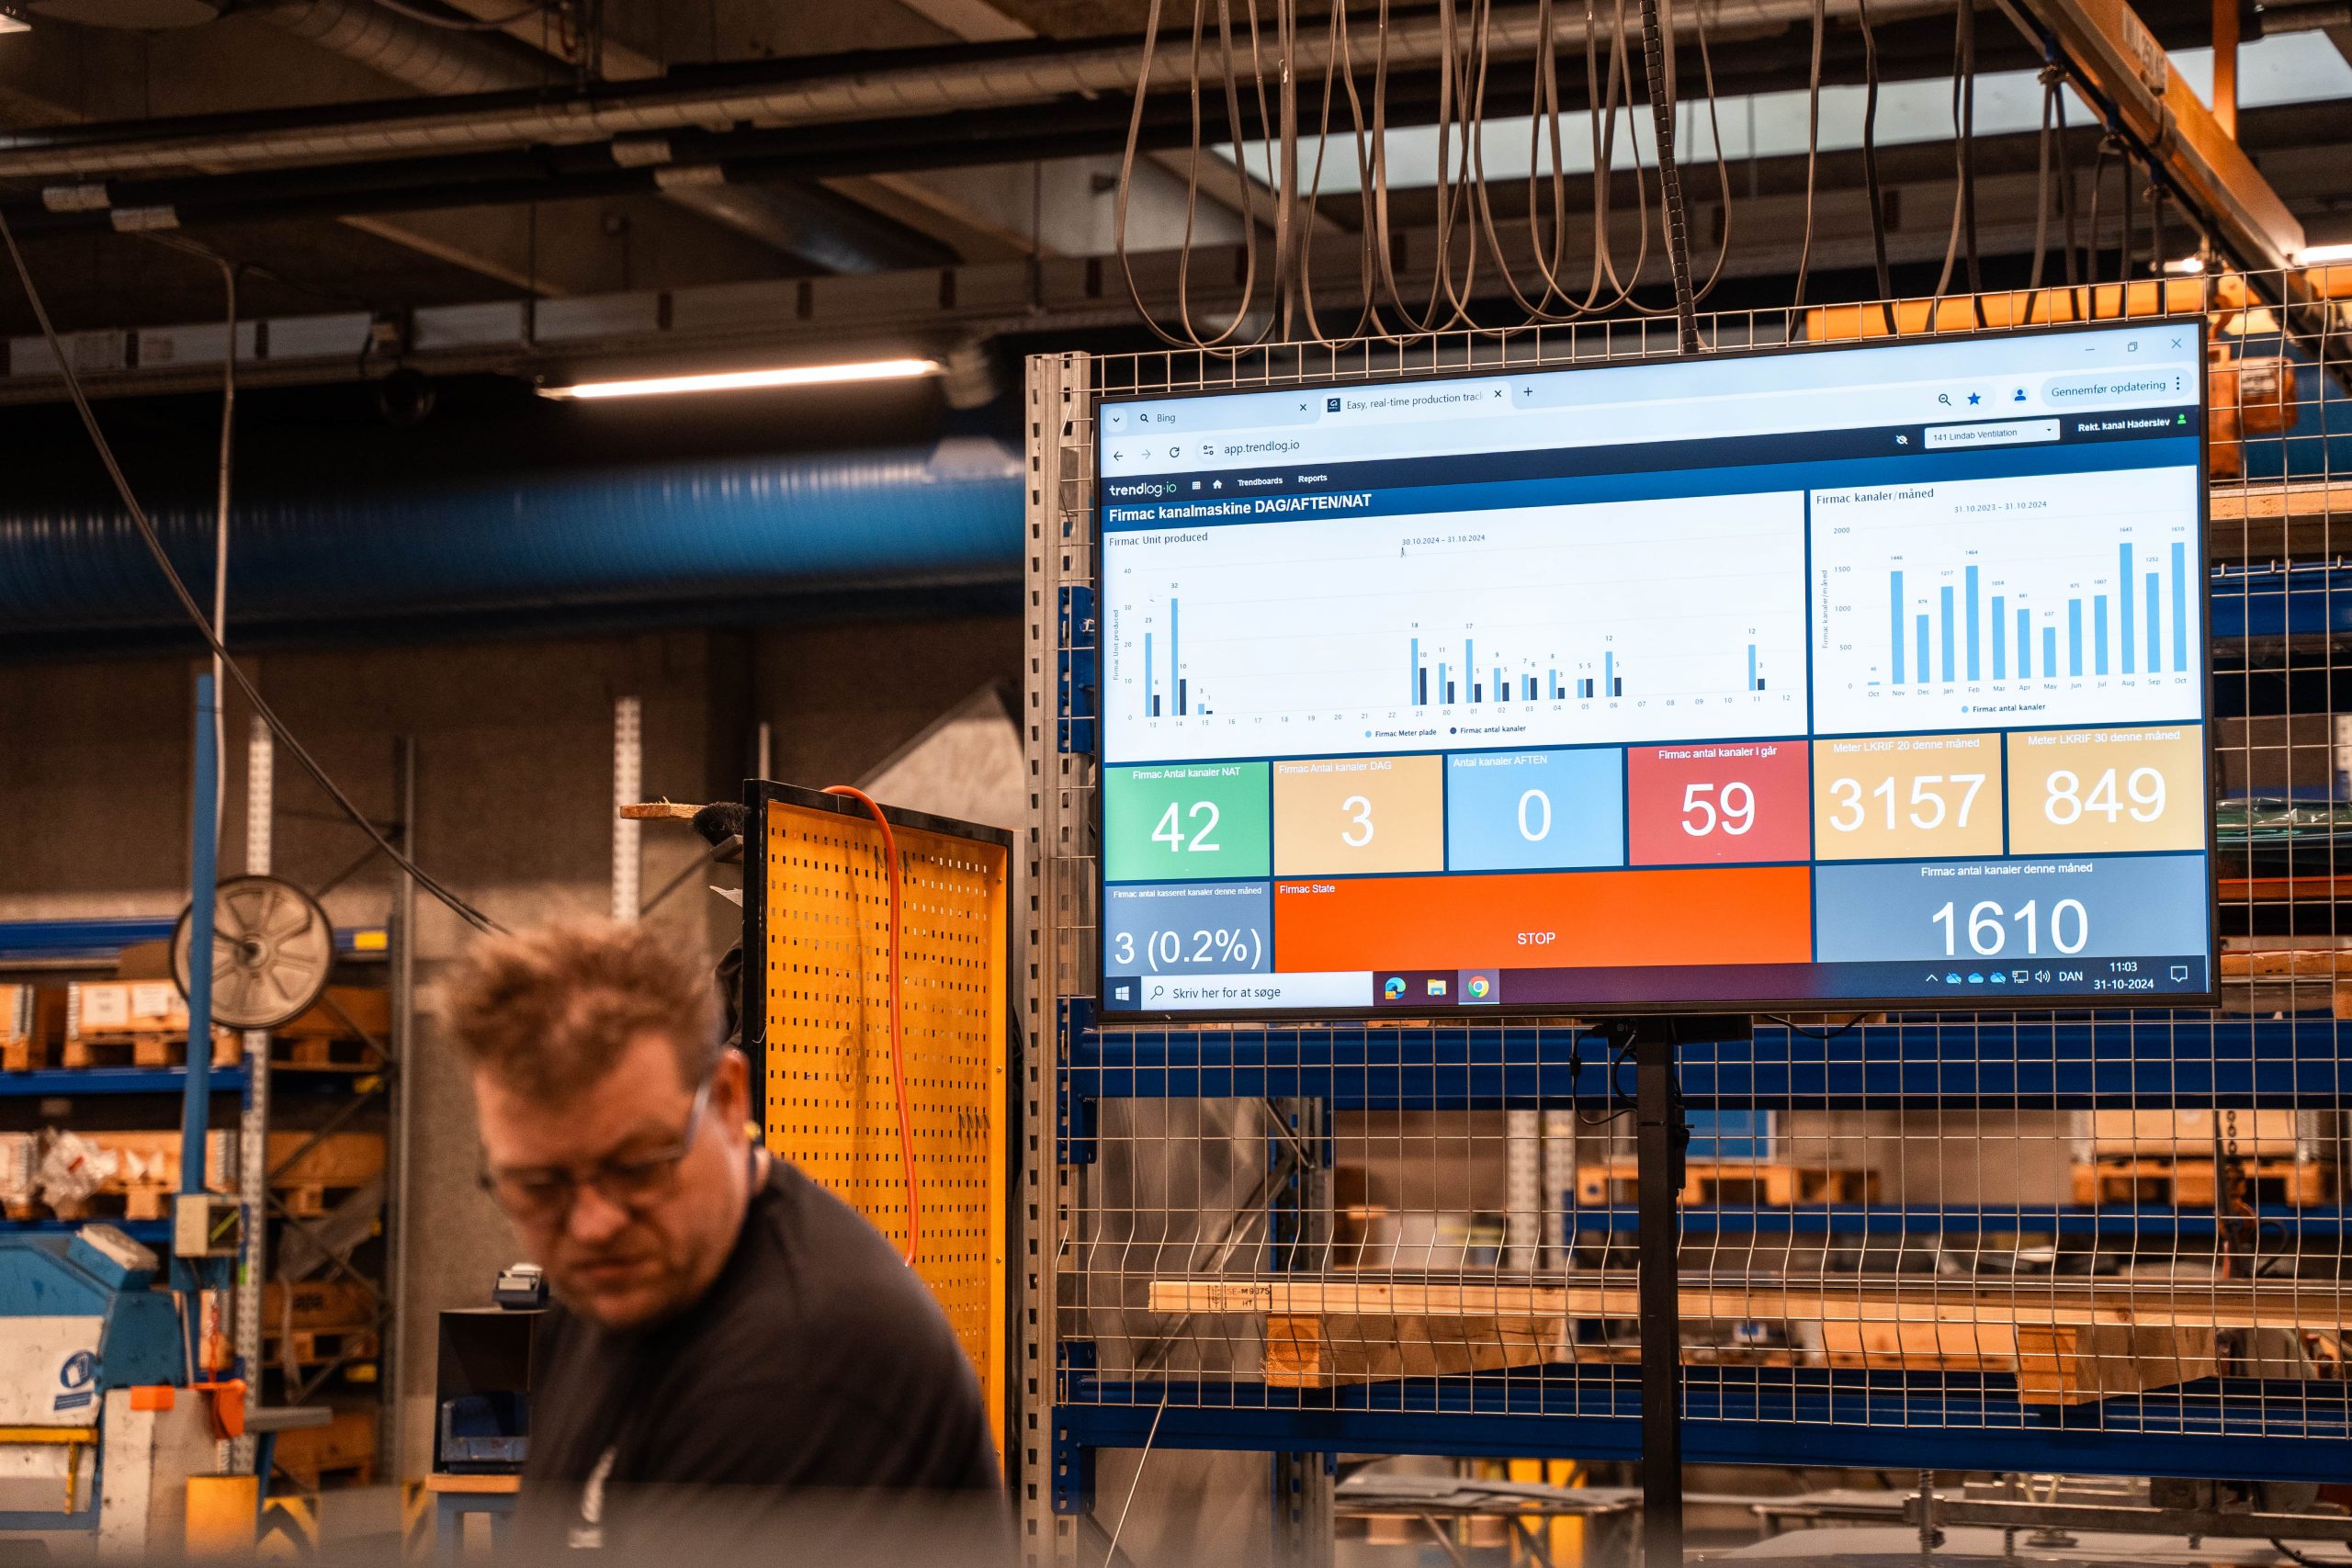
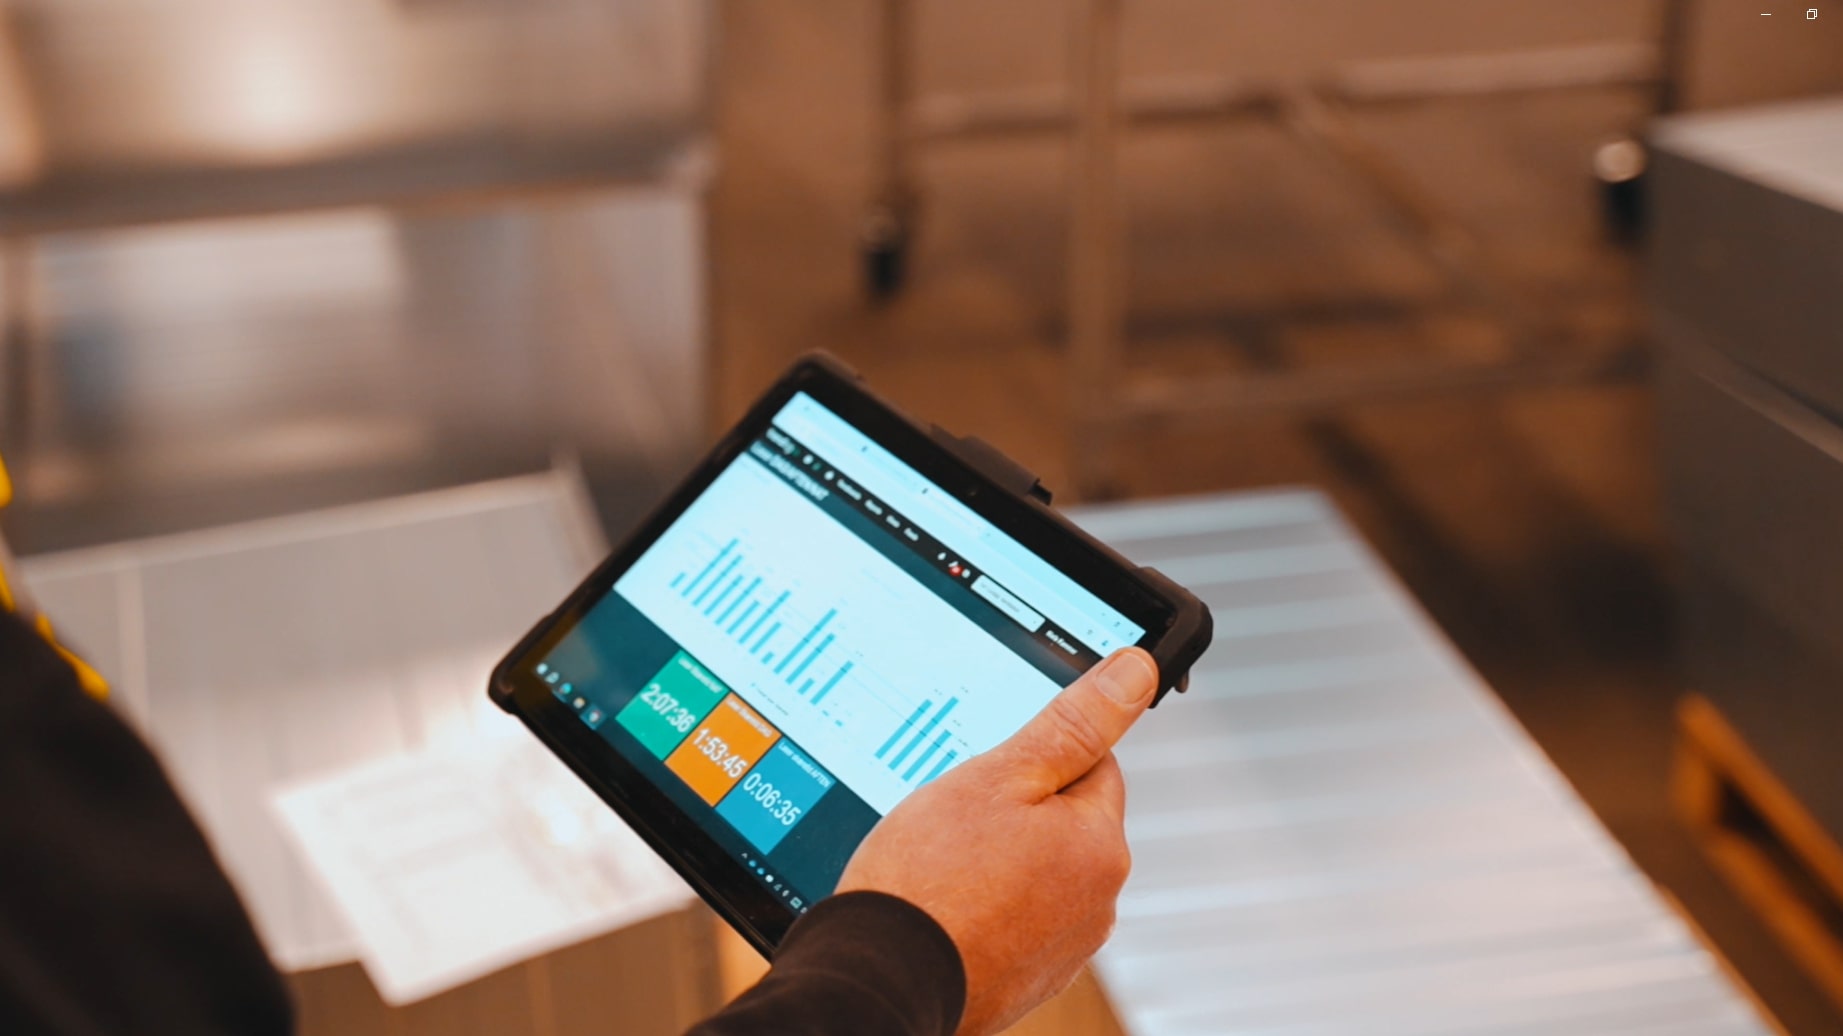
The biggest problem with production data isn’t that it’s missing—it’s that it arrives too late to be of any use. TrendOEE gives you a real-time view of what’s happening on your lines right now: OEE, downtime causes, shift performance, and speed losses, updated continuously. You can see which stoppages cost the most, compare lines and shifts against each other, and track whether an initiative is actually making a difference over time. Instead of discussing what happened yesterday, you can act on what’s happening now—and present management with facts, not assumptions.
End the trench warfare between production and engineering
MaintenancePLANNER
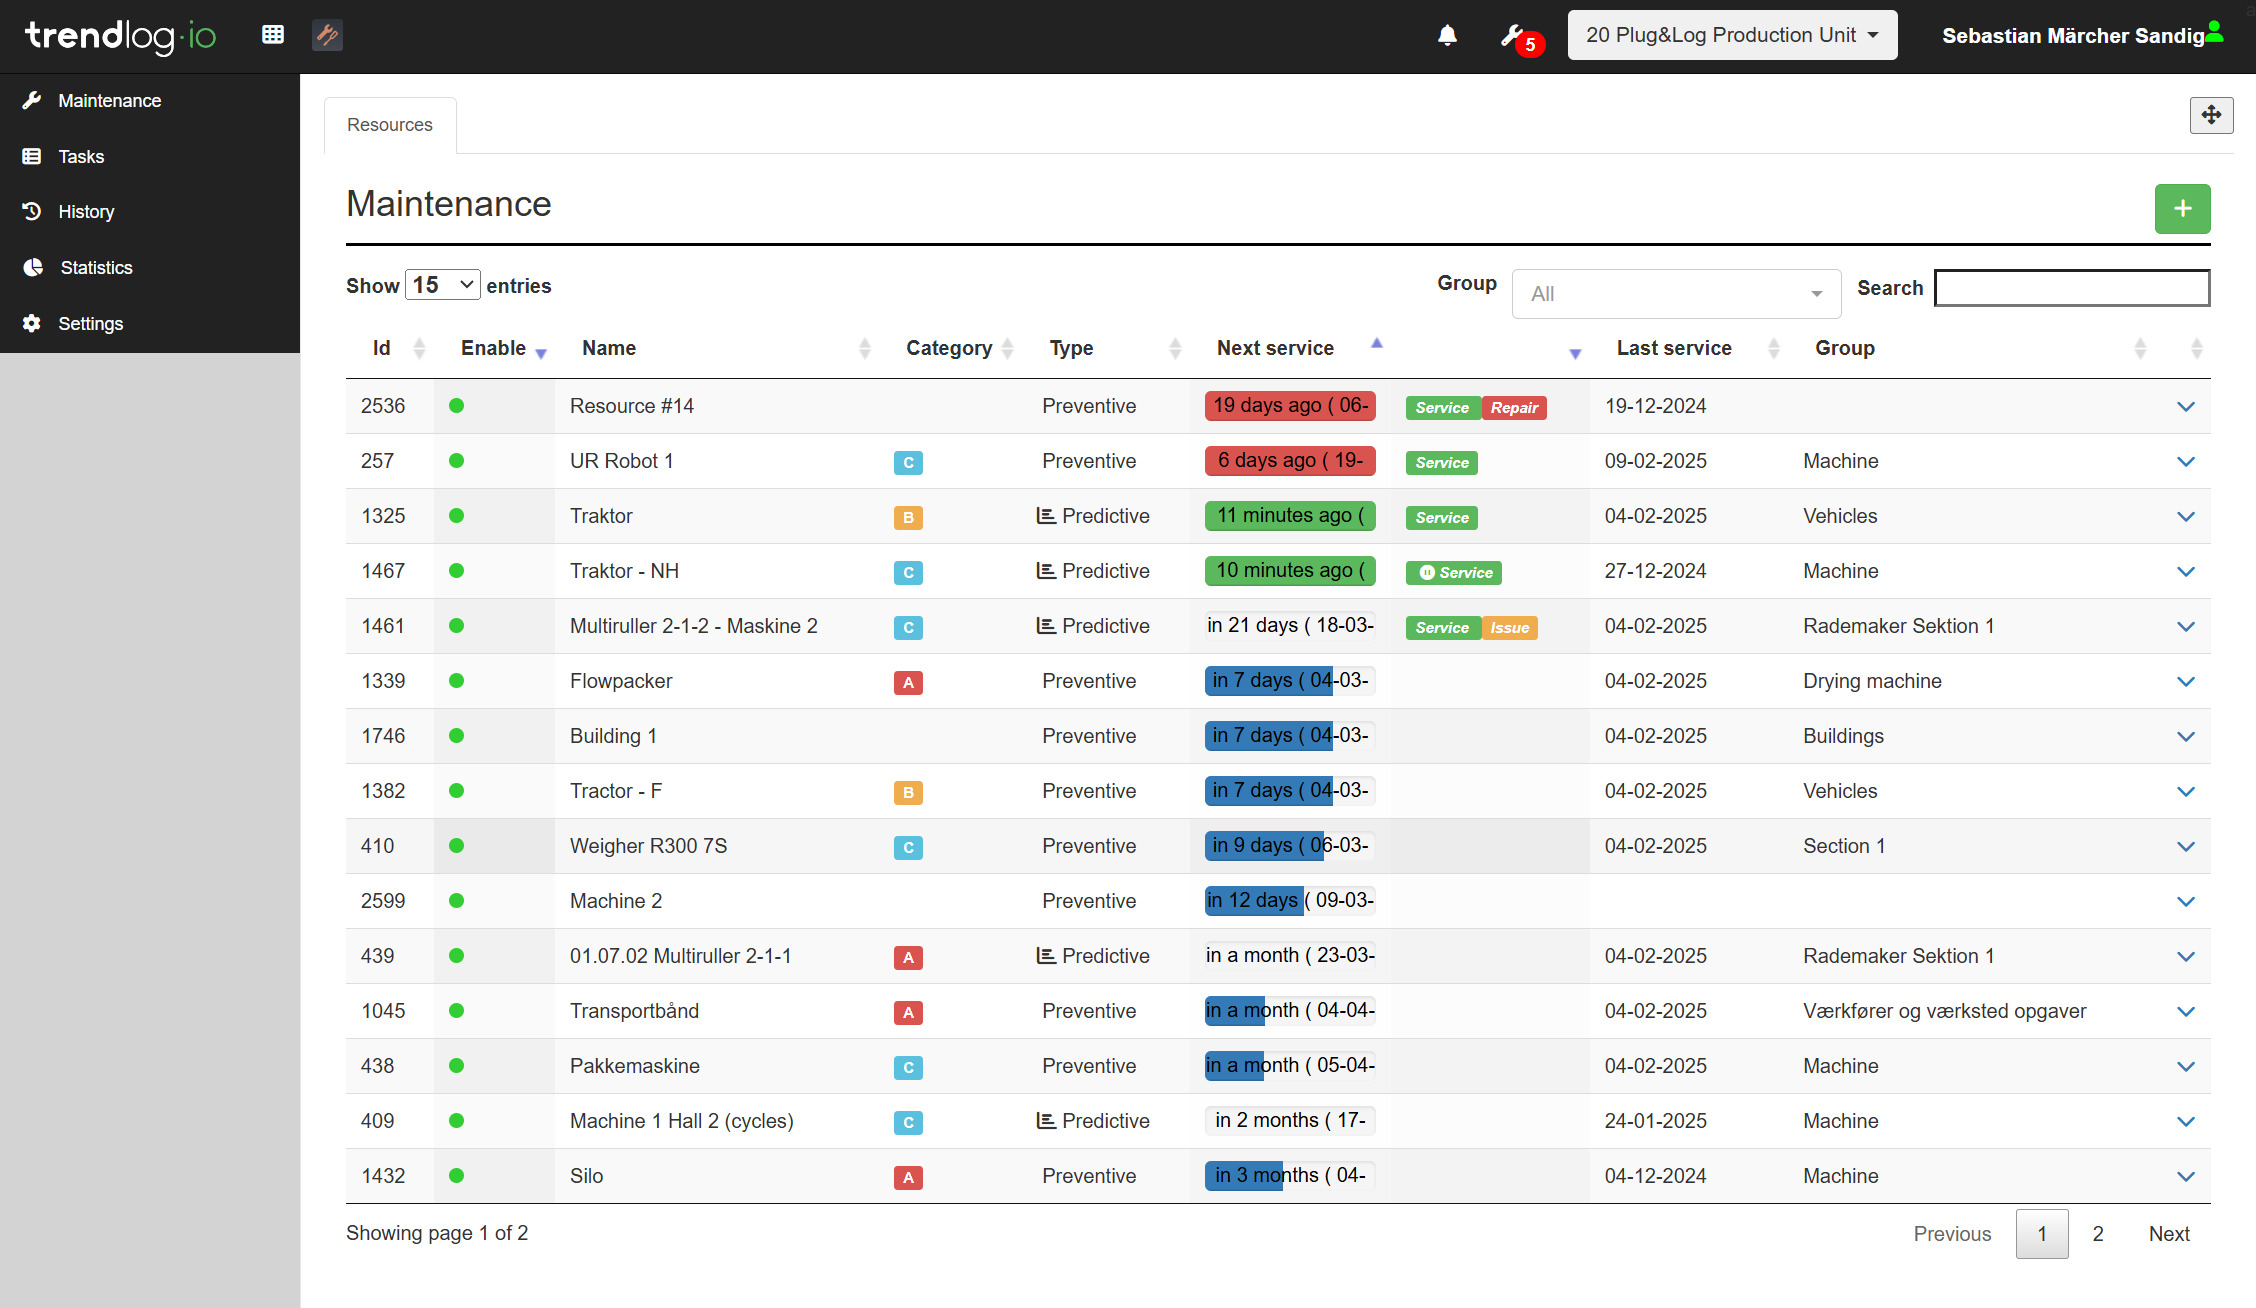
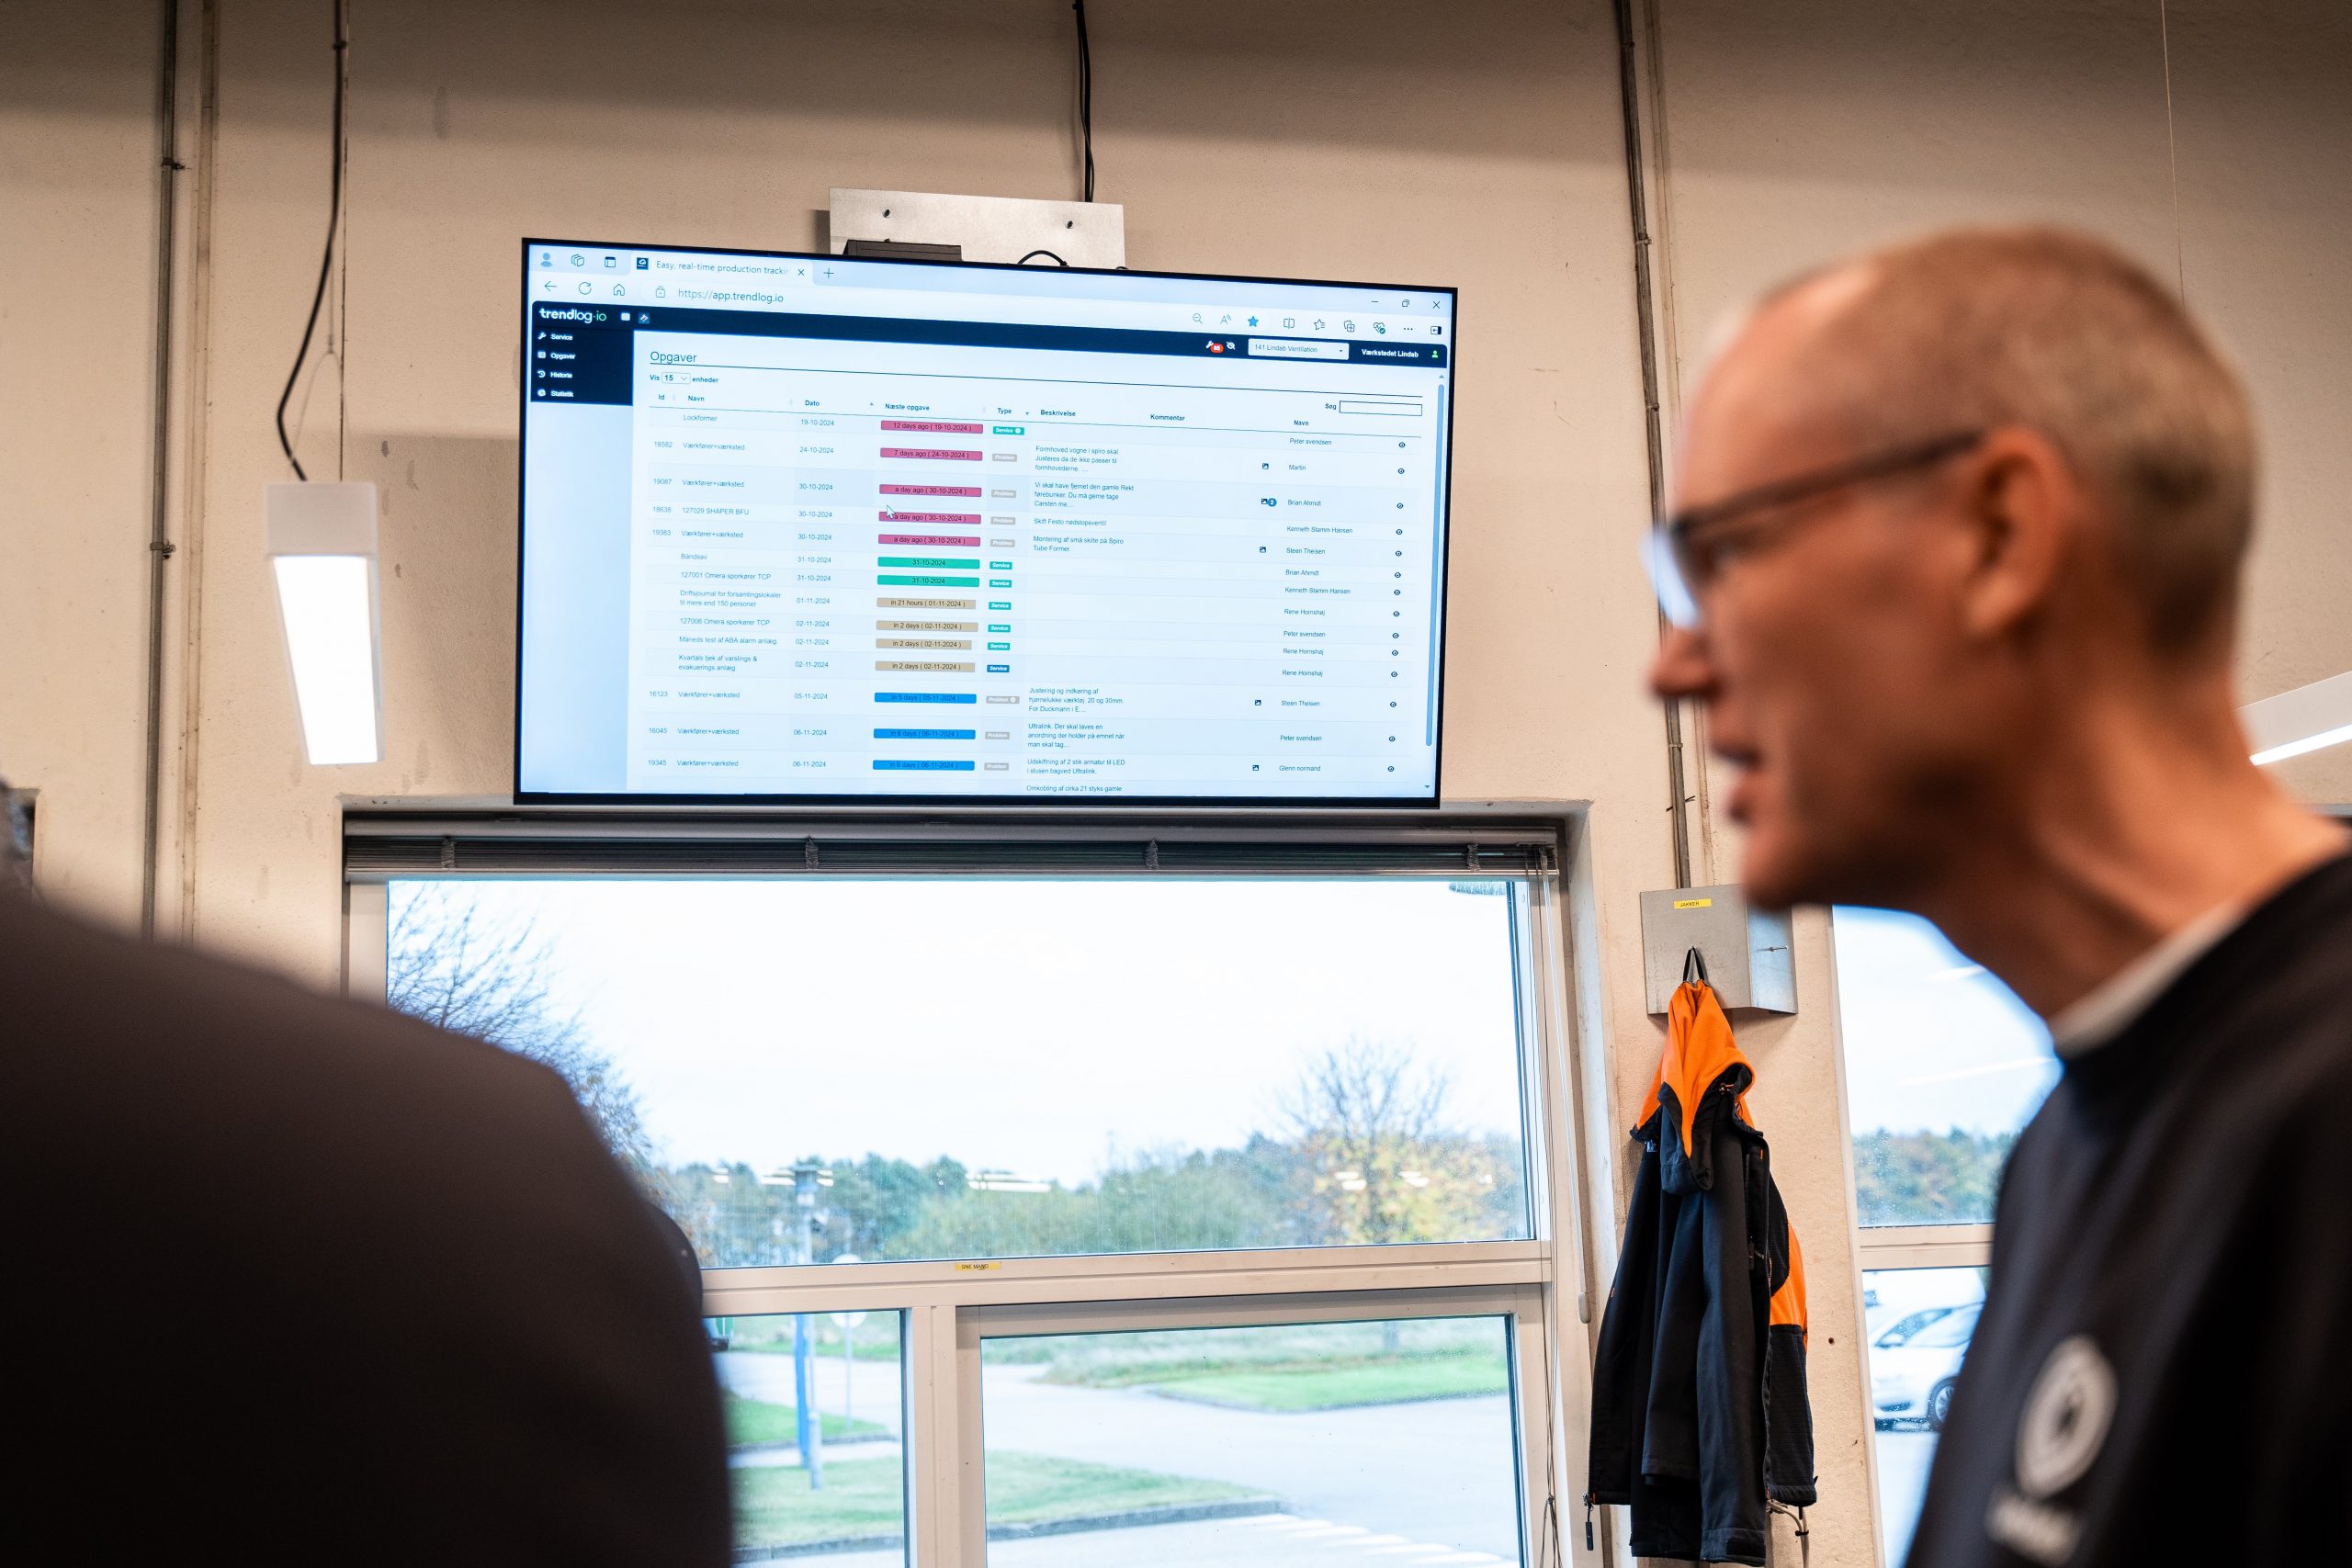
When a production line comes to a standstill, the question inevitably arises: Was it a lack of maintenance, or was it an operational issue? Without shared data, it turns into a discussion where no one is right and no one learns anything. With MaintenancePLANNER, as a production manager, you can view maintenance activities directly in the context of your production data—and the technical department gains an objective basis for taking action where it’s most needed. The result is fewer conflicts, shorter downtime, and a technical department that works according to the same priorities as you.
No more scrambling for pieces of paper before the management meeting
TrendFORMS
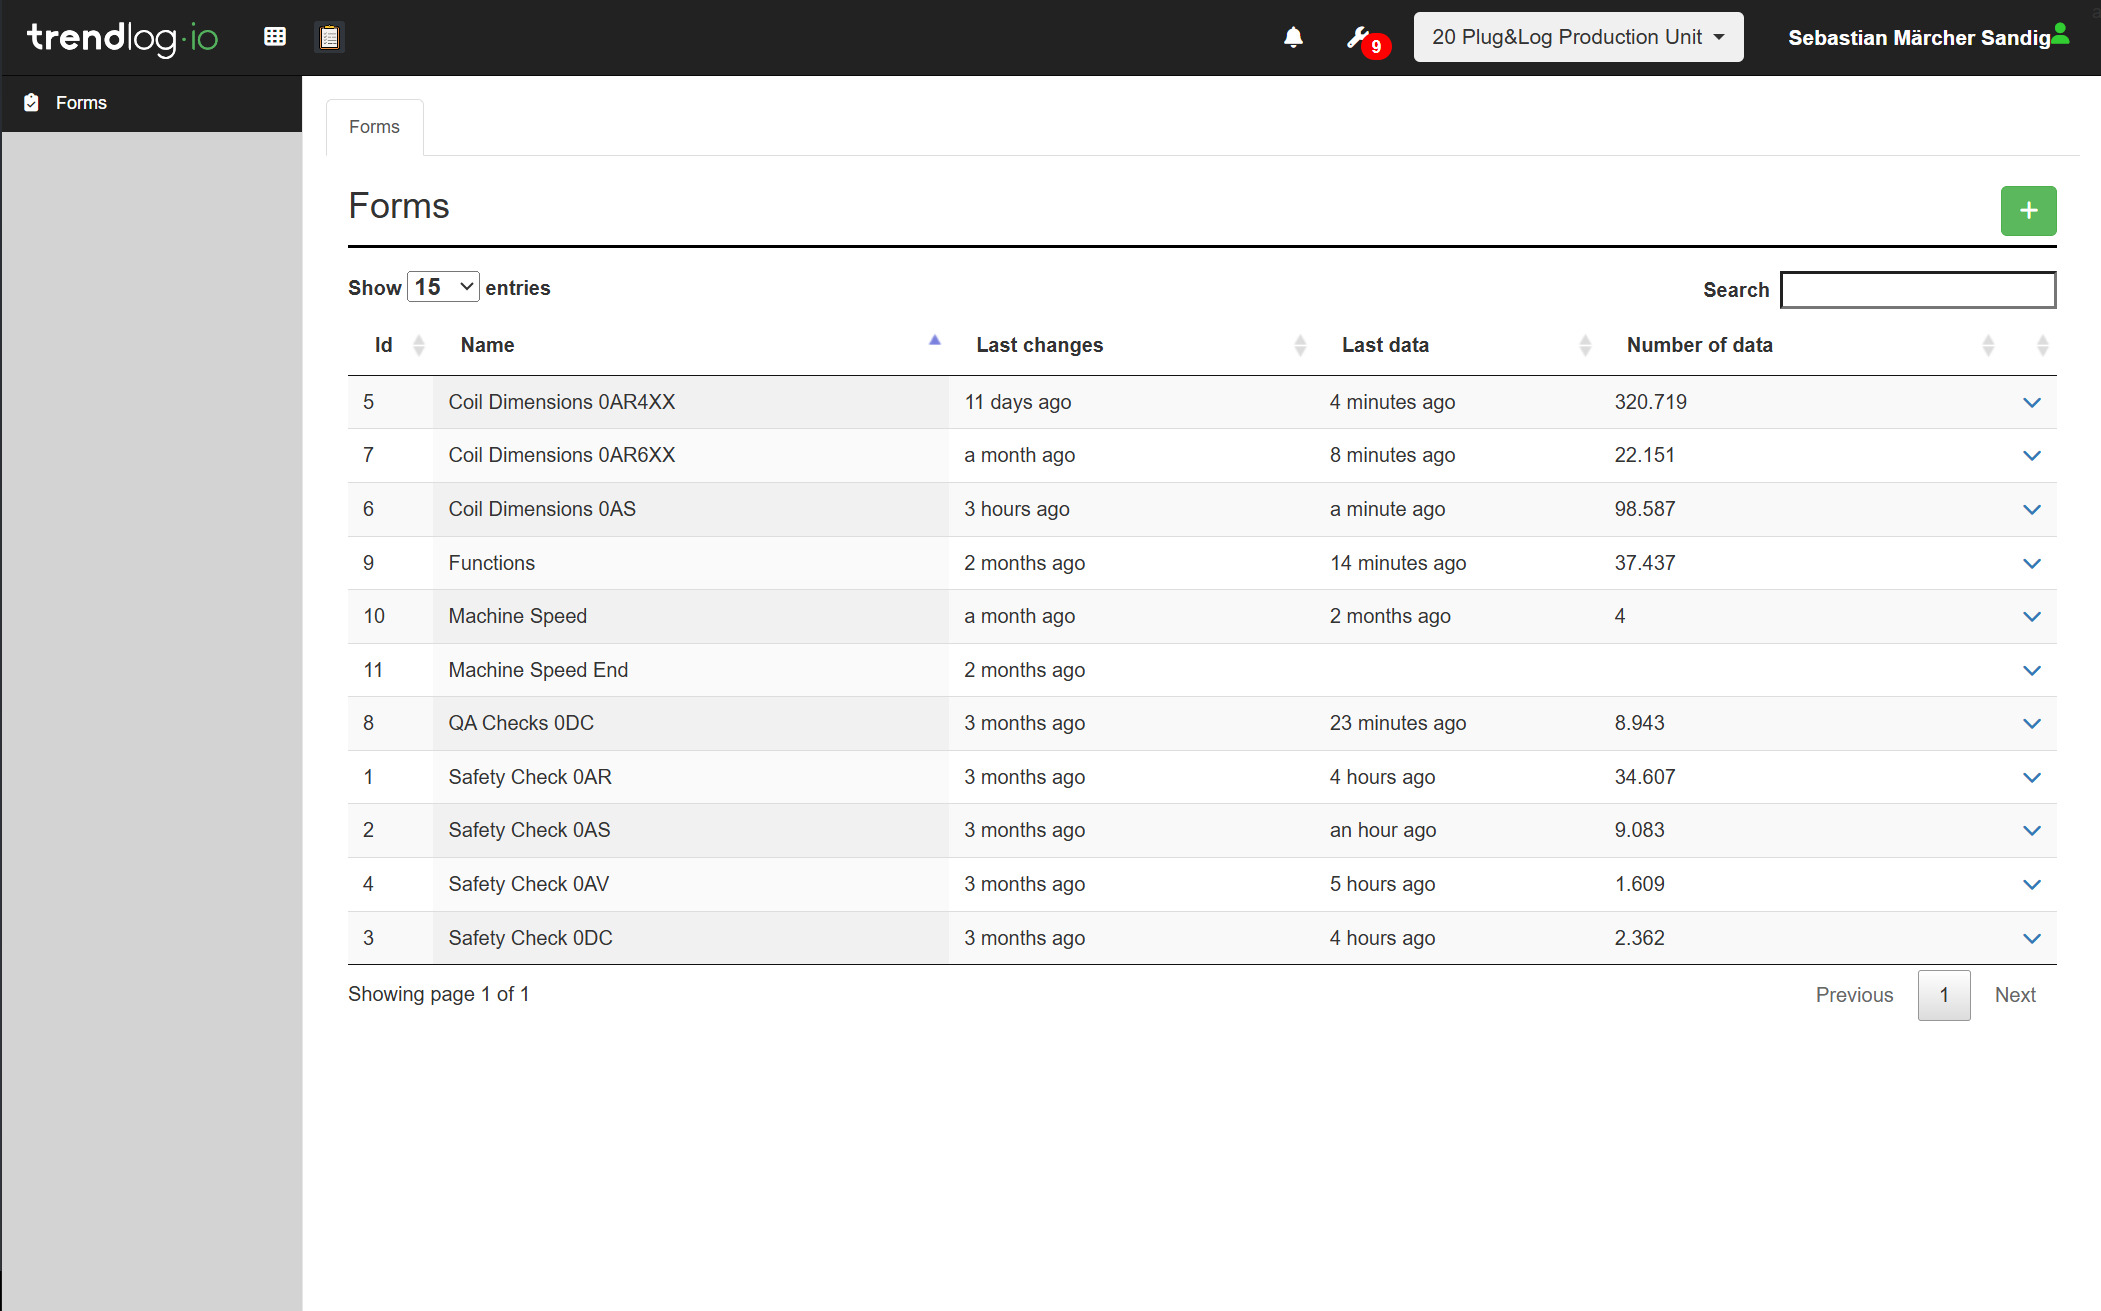
Much of what you, as a production manager, need to report on starts as an entry made on the shop floor—a checklist, a shift handoff, a pre-startup check. When this is done on paper or in scattered Excel spreadsheets, reporting becomes both slow and error-prone. TrendFORMS digitizes these records so they’re complete, searchable, and accurate from the moment they’re created. You’ll have less administrative work, fewer errors, and a documentation foundation that’s always ready—both for management reporting and for the next audit.
CALCULATE YOUR POTENTIAL
How much capacity is hidden in your OEE?
Micro-stops, startup waste, changeovers — these are often what eat away at your capacity without showing up on the books. Try our calculator and get an indication of what systematic OEE efforts could be worth to you. It takes less than a minute. The calculator is based on industry benchmarks and uses your own operational data to make the estimate. You will receive both your overall potential and a breakdown across four specific areas of improvement.
How much capacity is hidden in your machines?
In under 60 seconds, get an estimate based on your operations and industry benchmarks.
What industry are you in?
Selects your industry profile and pre-fills the next fields.
What does your operation look like?
We've set realistic defaults — adjust them if they don't fit.
How large is your production?
We use size to estimate your throughput and margin per unit.
How advanced is your OEE practice today?
Gut feeling is fine — it's just to estimate your starting point.
Systematic OEE work could be worth
Micro-stops and speed losses are often the largest hidden loss. Small stops of 30–60 seconds get treated as "normal operation" but can amount to 5–15% of available time.
Startup waste after order changeovers is rarely quantified. The first 30–60 minutes of a new order often run at 60–80% of nominal speed until settings and operator rhythm settle in.
Stop causes only become visible when you start measuring. Many know 5–6 typical stops but find 20–30 different ones in the data — and those are exactly the ones you can address systematically.
We've used your numbers and estimated the rest from industry benchmarks:
This is an indicative estimate based on industry benchmarks — not a precise assessment. It assumes that the freed capacity can be sold, or that it replaces equivalent overtime or postponed investments. Book a live demo for a precise calculation based on your own numbers.
Get a precise assessment — book a demo →Compliance & Documentation
Documented production — ready for audits and management reporting
For many production managers, audits are a recurring source of stress—not because production fails to meet requirements, but because the documentation is difficult to produce quickly enough. Trendlog turns this around by making documentation a natural byproduct of daily work, rather than a separate task to be completed before the auditor arrives.
IFS Food, BRCGS, and ISO 9001 all require traceability, record-keeping, and continuous improvement. With Trendlog, this data is generated and stored continuously, automatically, and in a structured manner—so you can present objective production data to customers, auditors, and certification bodies without spending days on preparation. It also provides you with a solid foundation for your own management reporting: the figures are the same, regardless of whether they’re used internally or externally.
Frequently Asked Questions
How is OEE calculated in practice?
OEE is calculated as the product of availability, performance, and quality, and provides a single, comprehensive figure for how efficiently your production time is utilized. In Trendlog, it is automatically recorded based on machine data, so you don’t have to calculate it manually and you get a reliable, comparable figure across production lines.
Can Trendlog be integrated with our ERP or MES system?
Yes. Trendlog complements existing systems rather than replacing them, with integrations via OPC-UA and Kepware, among others, as well as data exports to ERP. The specific possibilities depend on your setup and will be evaluated during a demo.
How soon can we get started?
Many customers are up and running with TrendOEE on their first production lines within a few weeks. We handle the setup and hardware (COLLECT box) to keep the internal workload low.
How much does it cost—and what do we get for our money?
Trendlog is subscription-based and priced per module and location, so you don’t pay for features you don’t use. We always conduct a detailed needs assessment so you can evaluate the ROI based on your actual production.
Platform Synergy with trendlog.io
As production manager, you’re at the center of it all—and that’s exactly why silos hit you the hardest. You’re the one who has to gather information from the technical department, from quality control, and from every shift, and piece together a picture that none of the systems provide on their own.
That’s the task Trendlog Production Suite eliminates. When TrendOEE, MaintenancePLANNER, and TrendFORMS run on the same platform, production data, maintenance history, and quality records are all gathered in one place. You don’t need to call the maintenance department to find out why Line 3 stopped. The next shift’s supervisor can see what happened during the previous shift. And management can track progress without waiting for a manual report.
Start with the module that addresses your biggest pain point. Keep building as it makes sense—the platform is ready, and the data is always interconnected.