

For the management
One overview of the whole business — across every site
As management you make decisions on investment, capacity and profitability, but the numbers arrive late, from different systems, in different formats. Trendlog consolidates the decisive KPIs: OEE, downtime, capacity utilisation and cost — from every plant into one real-time picture, so you steer on facts instead of last quarter’s report.

Have you ever been in these situations?
Key figures from the plants arrive late and in different formats.
The numbers land a day late, each plant in its own template — and they’re already outdated by the time you get a chance to act on them.
You can't compare sites — it's apples and oranges.
Each plant measures and defines things its own way, so you can’t line them up against each other — it’s apples and oranges, not one shared basis.
Investment decisions are made without one reliable, consolidated dataset.
Big investments are decided on scattered spreadsheets and gut feeling, because there’s never one consolidated, reliable number to base the call on.
How to keep track of production with Trendlog
Management starts with an overview delivered right to the inbox in the morning. It stands on top of the data foundation the individual departments already build in TrendOEE, maintenance and quality. One platform, one truth — from floor to board.
Insights right to your inbox
Reports
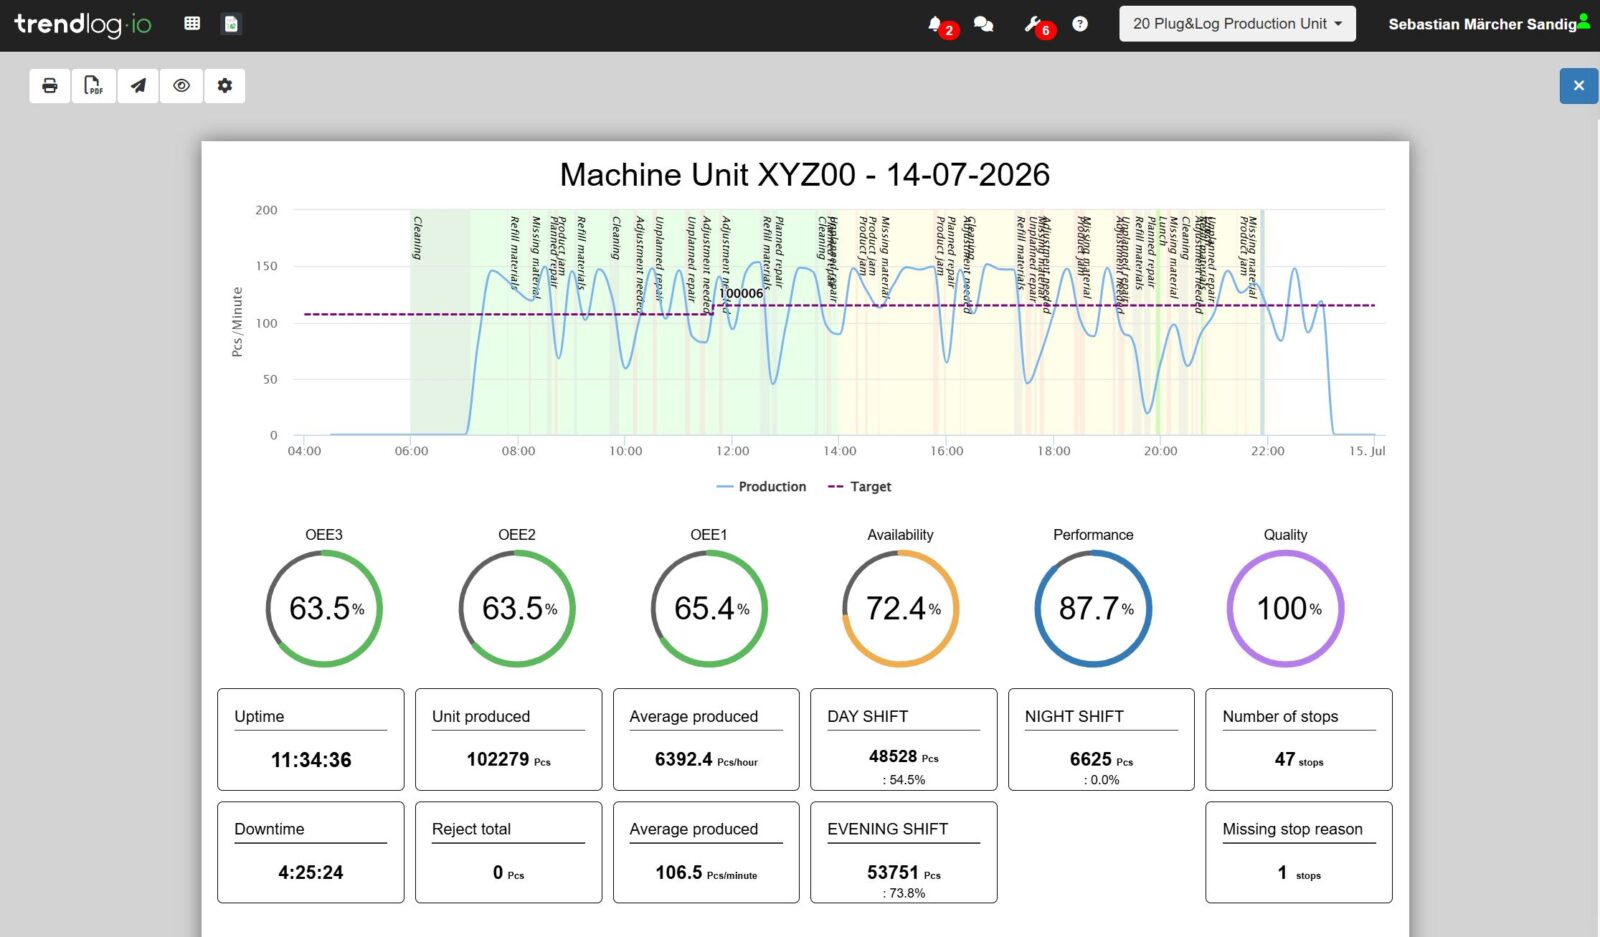
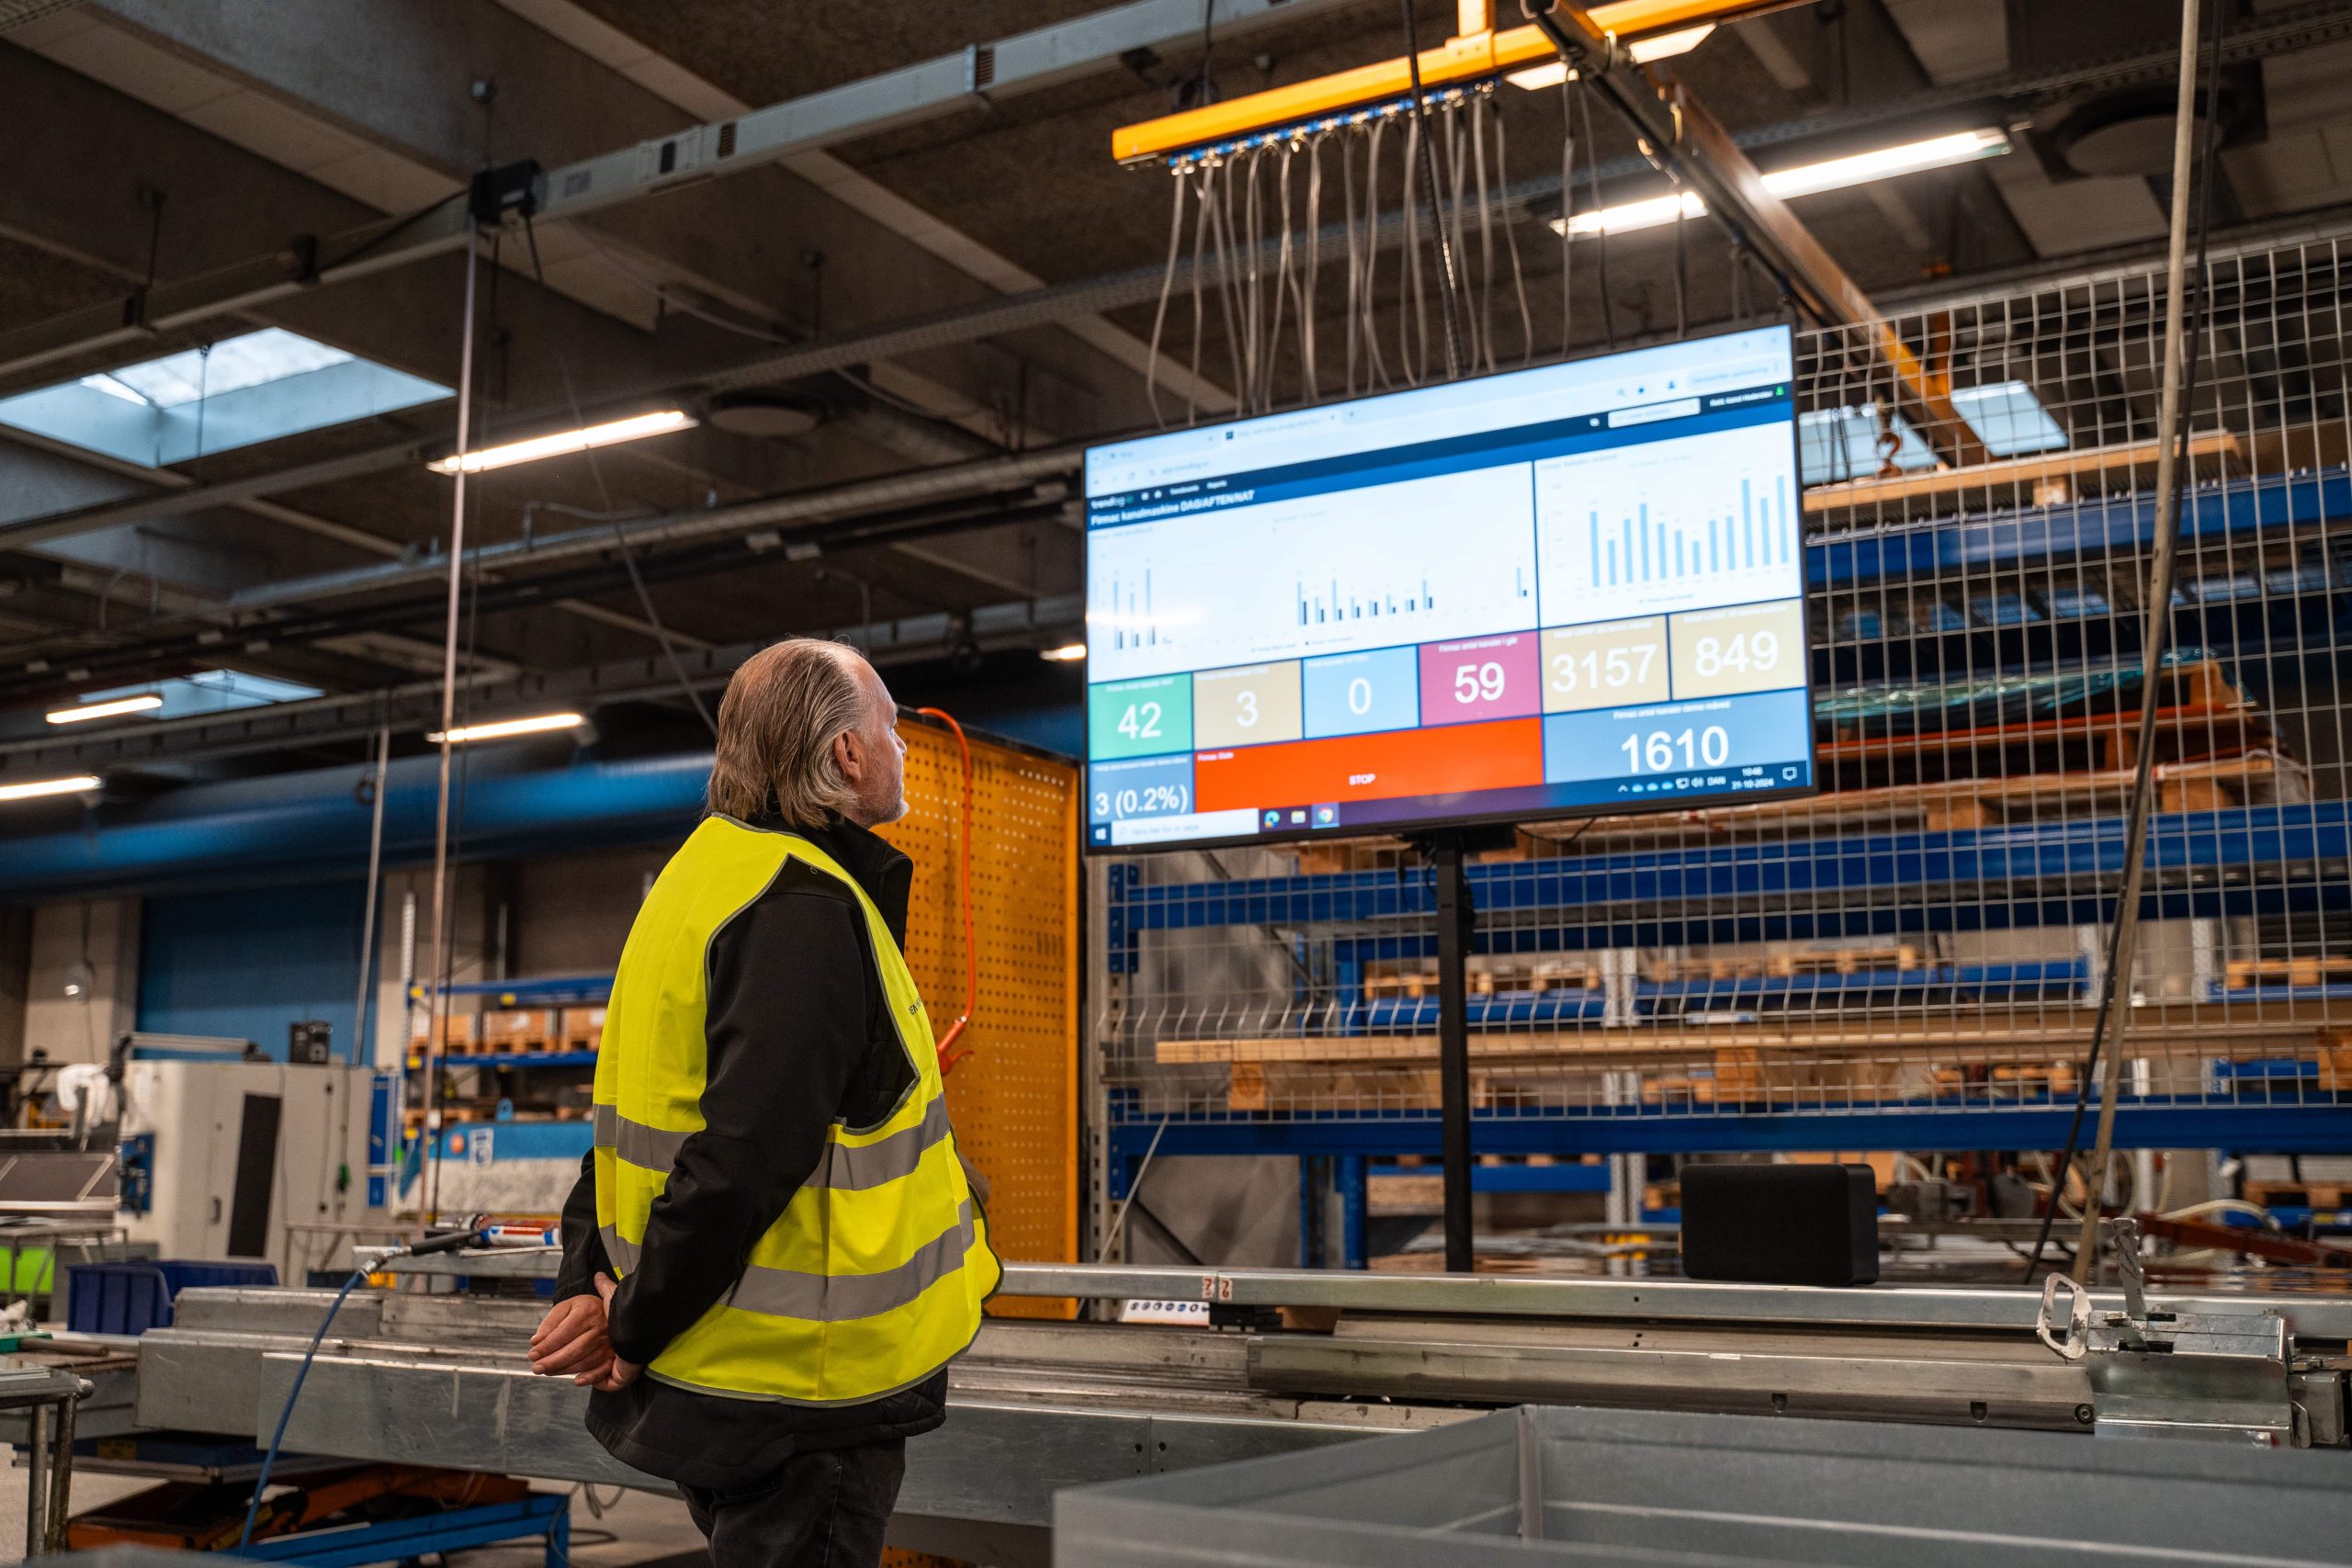
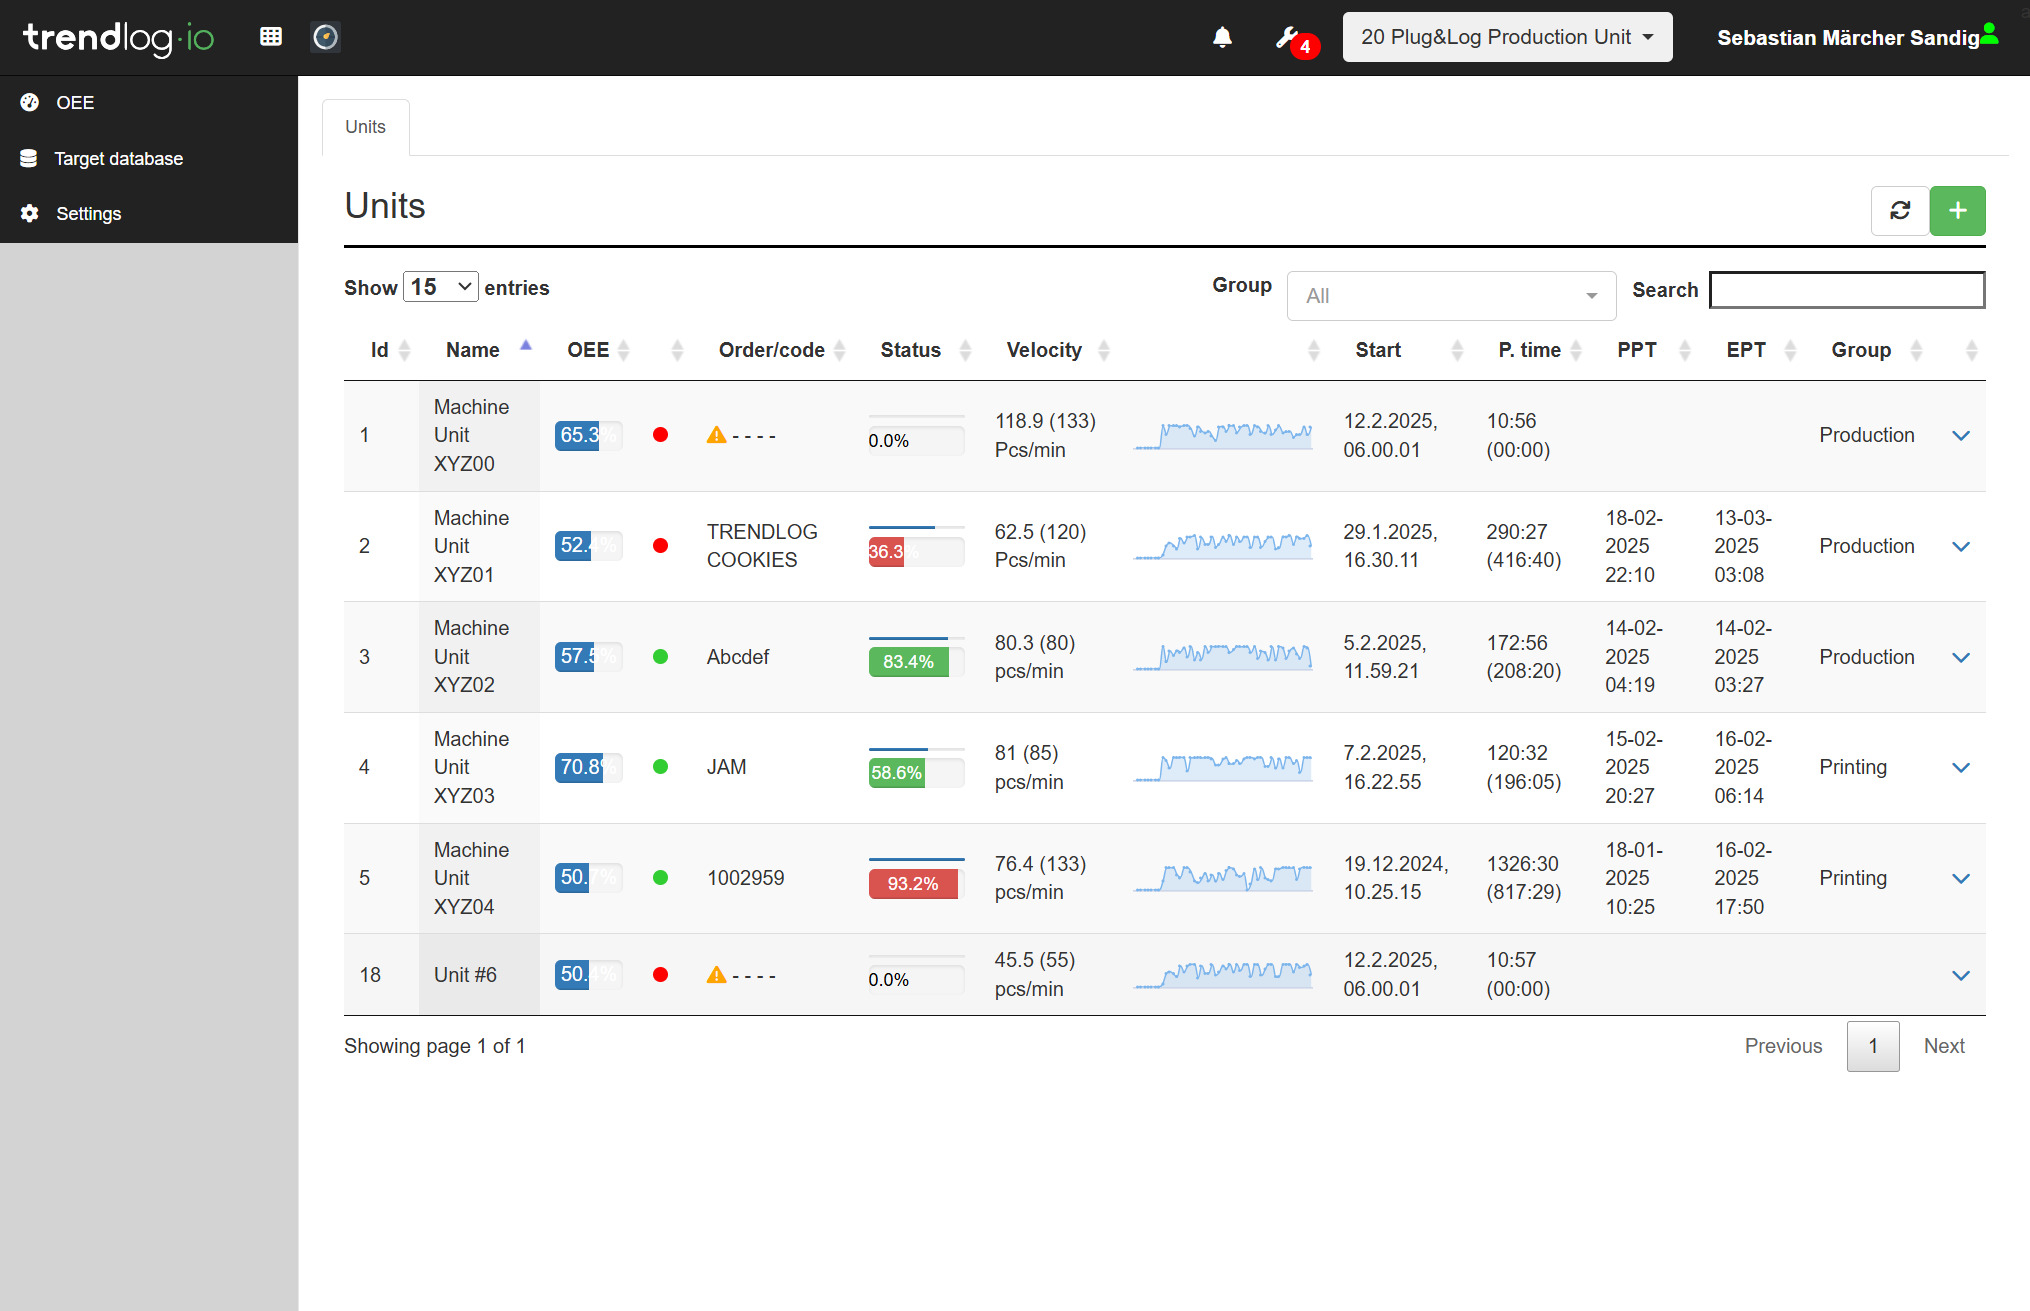
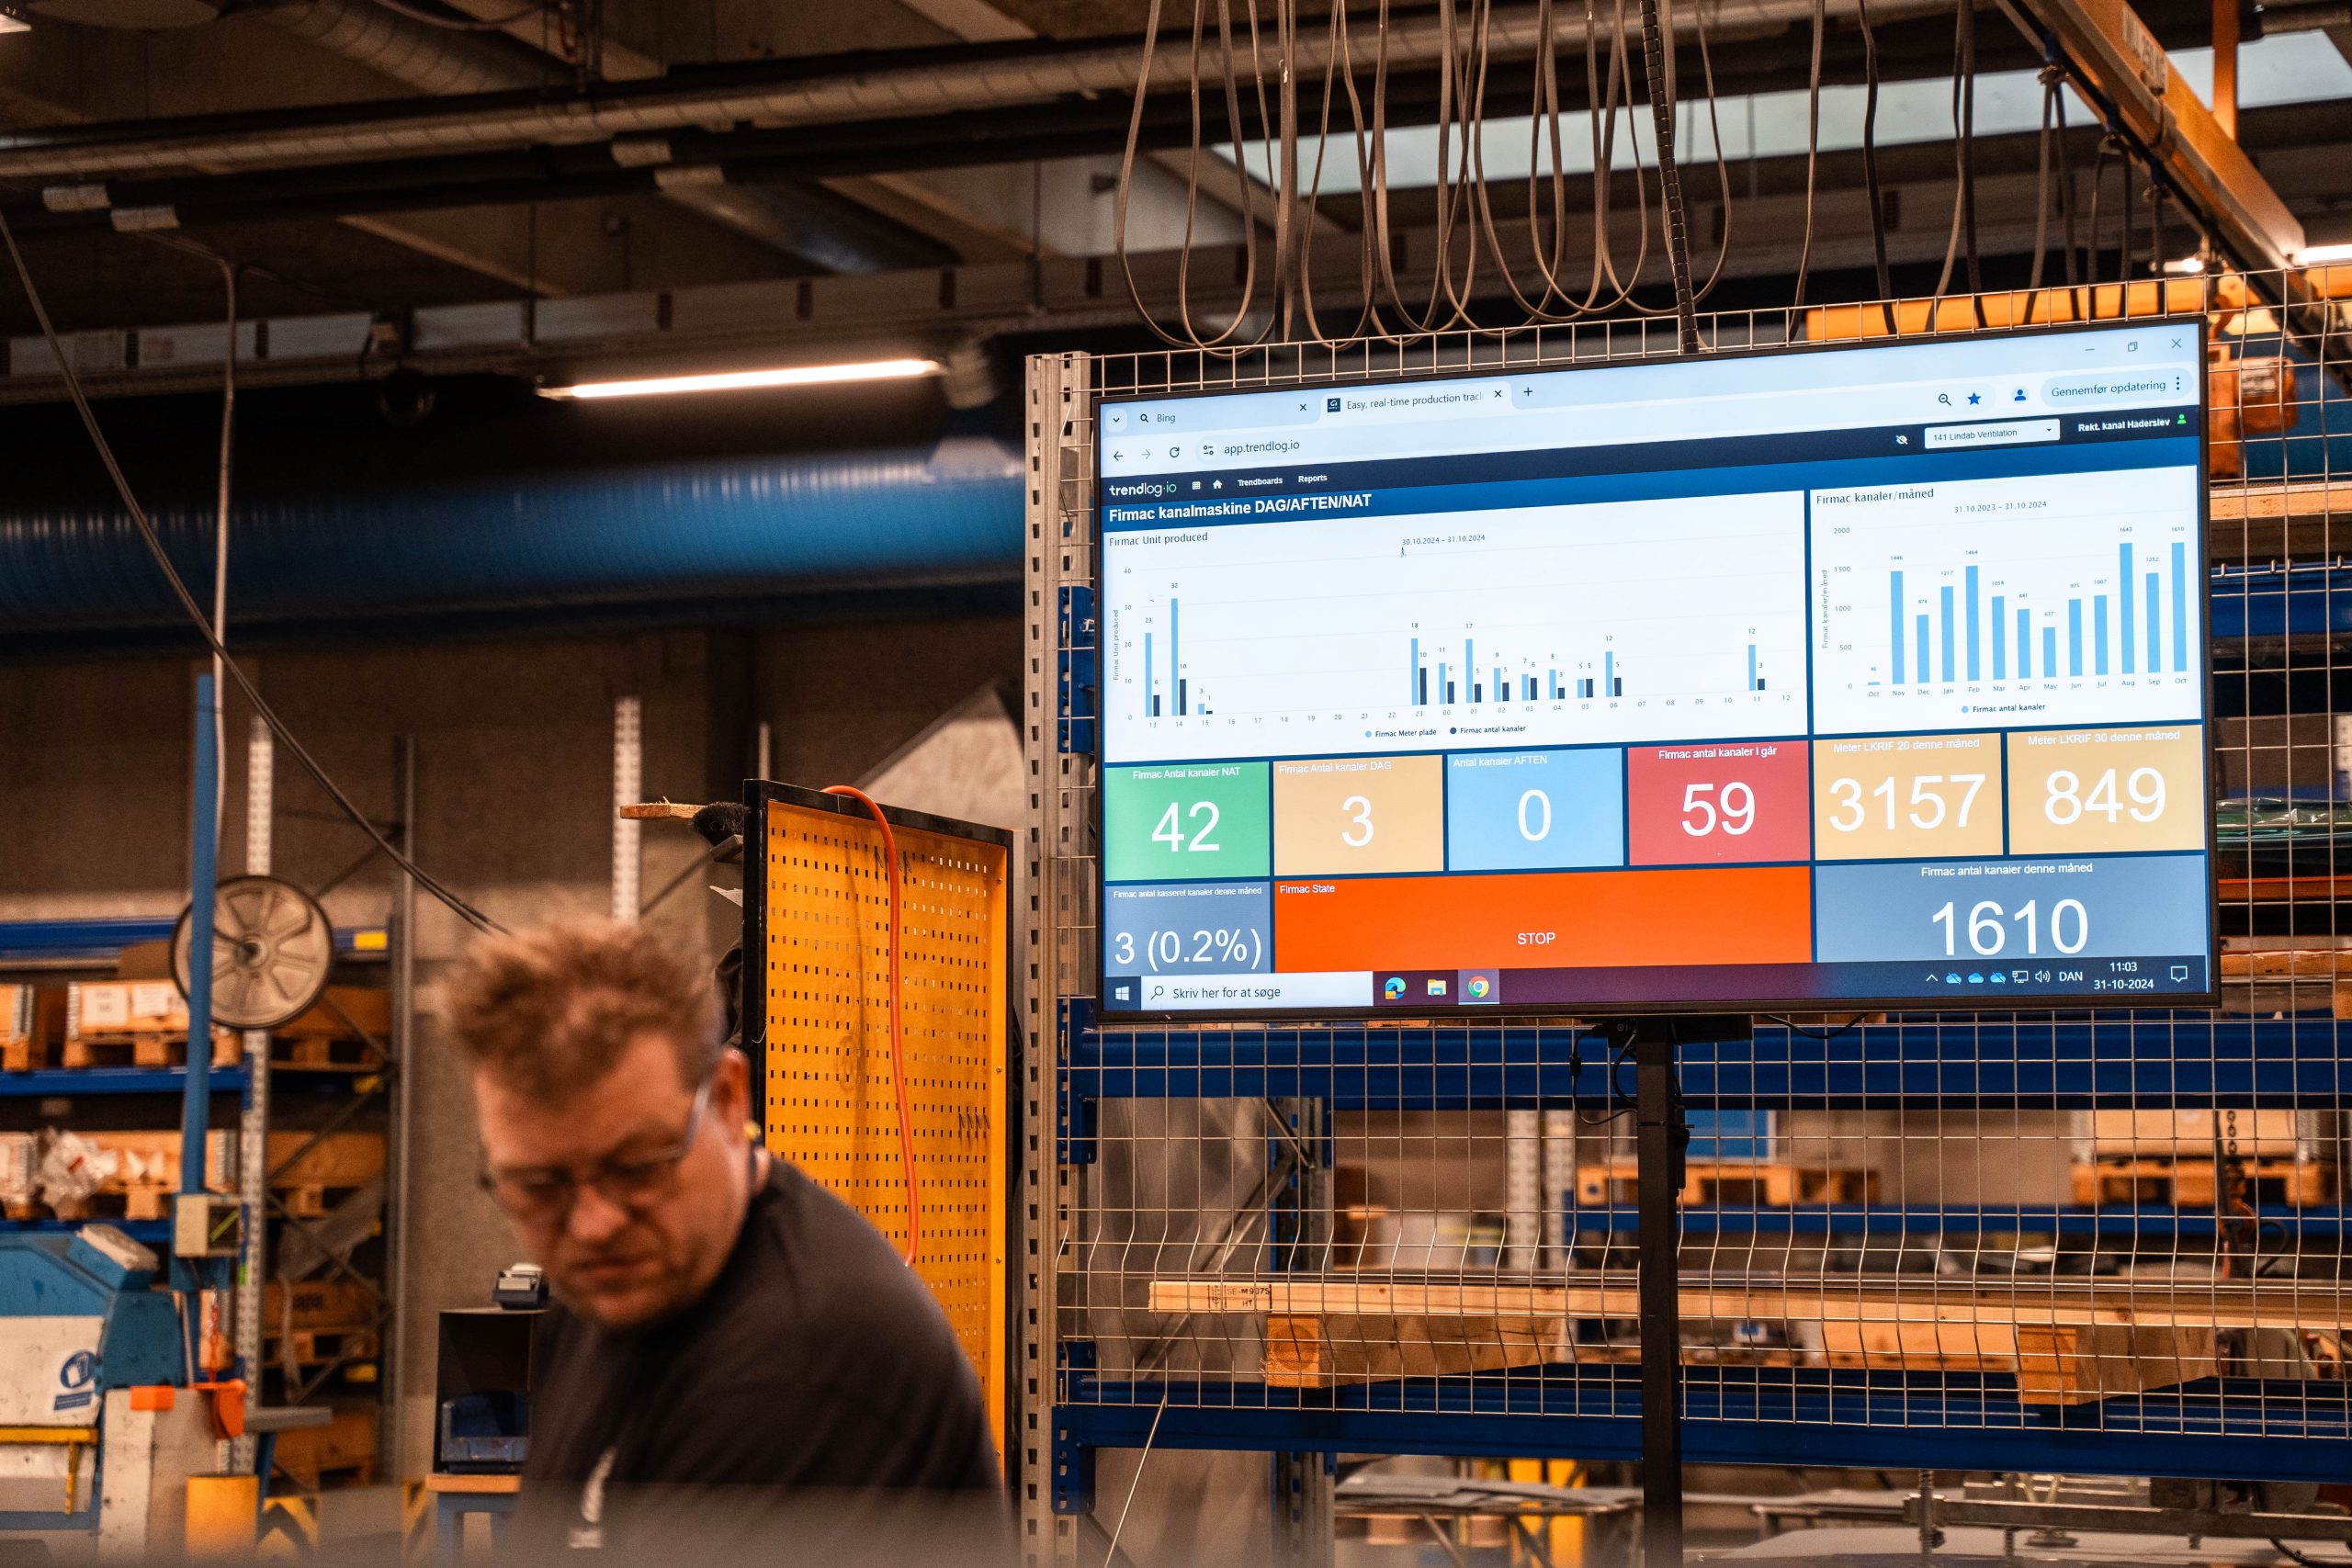
Consolidated dashboards and reports across every site: OEE, downtime, capacity utilisation and cost per unit — in real time and with full history. Because every plant is built on the same definitions, you can finally benchmark them against each other on one basis instead of apples and oranges, and see the trend per month, quarter and year. For management it replaces scattered spreadsheets and delayed monthly reports with one steering picture you can act on at once — so investment and capacity decisions rest on facts from the floor rather than gut feeling.
From dead data to real-time insights
TrendOEE
The operational foundation beneath the management figures: actual production efficiency per line and site, calculated in real time from machine data rather than manual reports. This is where the KPIs are anchored, so the numbers the board sees can be traced all the way down to the individual machine and shift. And because the floor and management see exactly the same figure, the argument over whose data is right disappears. For management it means a basis for decisions you can trust — and a direct line from the strategic KPI to the concrete operational cause behind it.
Full consumption tracking and cost overview
TrendENERGY
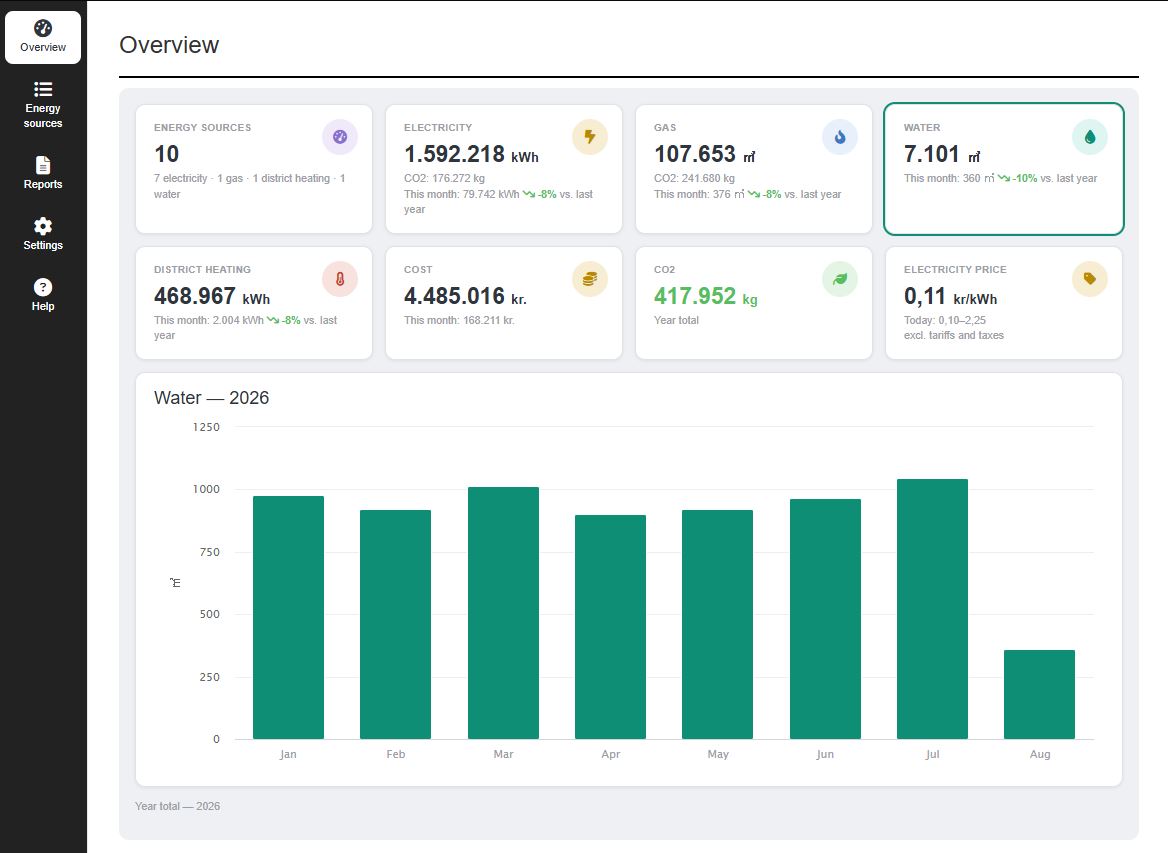
Energy use and cost measured per site — both for plain cost control and for ESG and sustainability reporting under CSRD and ISO 50001. It’s a demand rising from several sides at once: boards, banks and customers want documented figures, not estimates. When energy data sits in the same platform as OEE and the operational figures, you can report on consumption and CO2 without a separate data-collection project. For management, sustainability thereby becomes a natural part of the overall steering picture — and an area where concrete savings and compliance go hand in hand.

CALCULATE YOUR POTENTIAL
What's the total hidden capacity across your sites?
Micro-stops, startup waste, changeovers — these are often what eat away at your capacity without showing up on the books. Try our calculator and get an indication of what systematic OEE efforts could be worth to you. It takes less than a minute. The calculator is based on industry benchmarks and uses your own operational data to make the estimate. You will receive both your overall potential and a breakdown across four specific areas of improvement.
How much capacity is hidden in your machines?
In under 60 seconds, get an estimate based on your operations and industry benchmarks.
What industry are you in?
Selects your industry profile and pre-fills the next fields.
What does your operation look like?
We've set realistic defaults — adjust them if they don't fit.
How large is your production?
We use size to estimate your throughput and margin per unit.
How advanced is your OEE practice today?
Gut feeling is fine — it's just to estimate your starting point.
Systematic OEE work could be worth
Micro-stops and speed losses are often the largest hidden loss. Small stops of 30–60 seconds get treated as "normal operation" but can amount to 5–15% of available time.
Startup waste after order changeovers is rarely quantified. The first 30–60 minutes of a new order often run at 60–80% of nominal speed until settings and operator rhythm settle in.
Stop causes only become visible when you start measuring. Many know 5–6 typical stops but find 20–30 different ones in the data — and those are exactly the ones you can address systematically.
We've used your numbers and estimated the rest from industry benchmarks:
This is an indicative estimate based on industry benchmarks — not a precise assessment. It assumes that the freed capacity can be sold, or that it replaces equivalent overtime or postponed investments. Book a live demo for a precise calculation based on your own numbers.
Get a precise assessment — book a demo →Compliance & documentation
One audit trail — from operational KPIs to ESG reporting
Consolidated, auditable data across sites: operational KPIs, quality and maintenance documentation, and energy figures, ready for ISO certifications and for CSRD/ESG reporting. One foundation for both operations and what the board and auditor ask for.
IFS Food, BRCGS, and ISO 9001 all require traceability, record-keeping, and continuous improvement. With Trendlog, this data is generated and stored continuously, automatically, and in a structured manner—so you can present objective production data to customers, auditors, and certification bodies without spending days on preparation. It also provides you with a solid foundation for your own management reporting: the figures are the same, regardless of whether they’re used internally or externally.

Frequently Asked Questions
Can we compare several plants against each other?
Yes — with shared definitions for OEE, stops and KPIs, every site looks the same, so you can benchmark plants and departments on one basis. No more apples and oranges.
How real-time are the management figures?
The figures are built on real-time machine data, so you don’t wait for the monthly report. You can make decisions while they still make a difference.
Does Trendlog support ESG and CSRD reporting?
Yes — energy and resource data is gathered per site and can be used directly in ESG and CSRD reporting, alongside the operational KPIs. One dataset for both operations and sustainability.
What does it take to get started across several sites?
You typically start with one site and one module, prove the value, and roll out. The platform is module-based and scalable — no big bang, no heavy group-level IT project.
From floor to board — one platform, one truth
Production, maintenance, quality and energy each build their data in the Trendlog Production Suite — and management gets it all in one overview. The same number on the floor and in the boardroom means faster, better decisions and no argument over whose data counts. Start with the module that addresses your biggest pain point. Keep building as it makes sense—the platform is ready, and the data is always interconnected.