Gain Overview, Insight, and Control
Custom dashboards
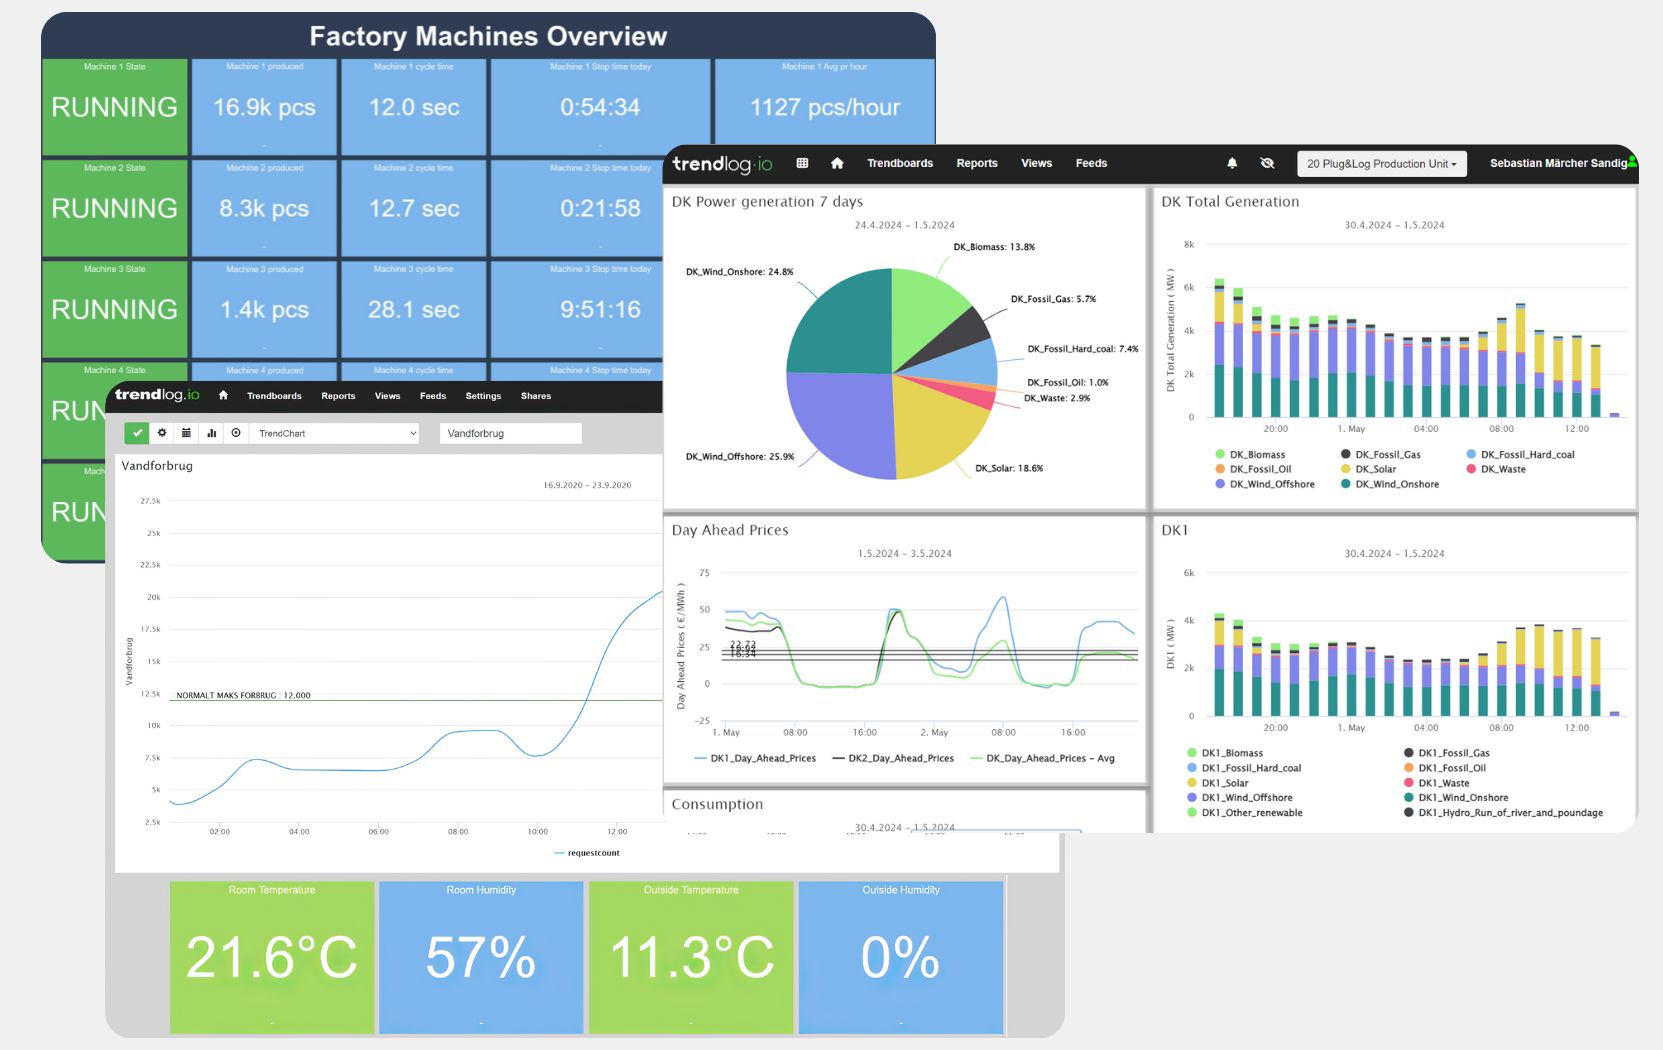
Trendlog.io gives you more than just data. You get a flexible platform where you can customize dashboards, set up alerts, and respond quickly to fluctuations in operations and consumption. With intuitive tools, you’ll have a complete overview – and the ability to act instantly.


Customized dashboards
Build dashboards that fit your role
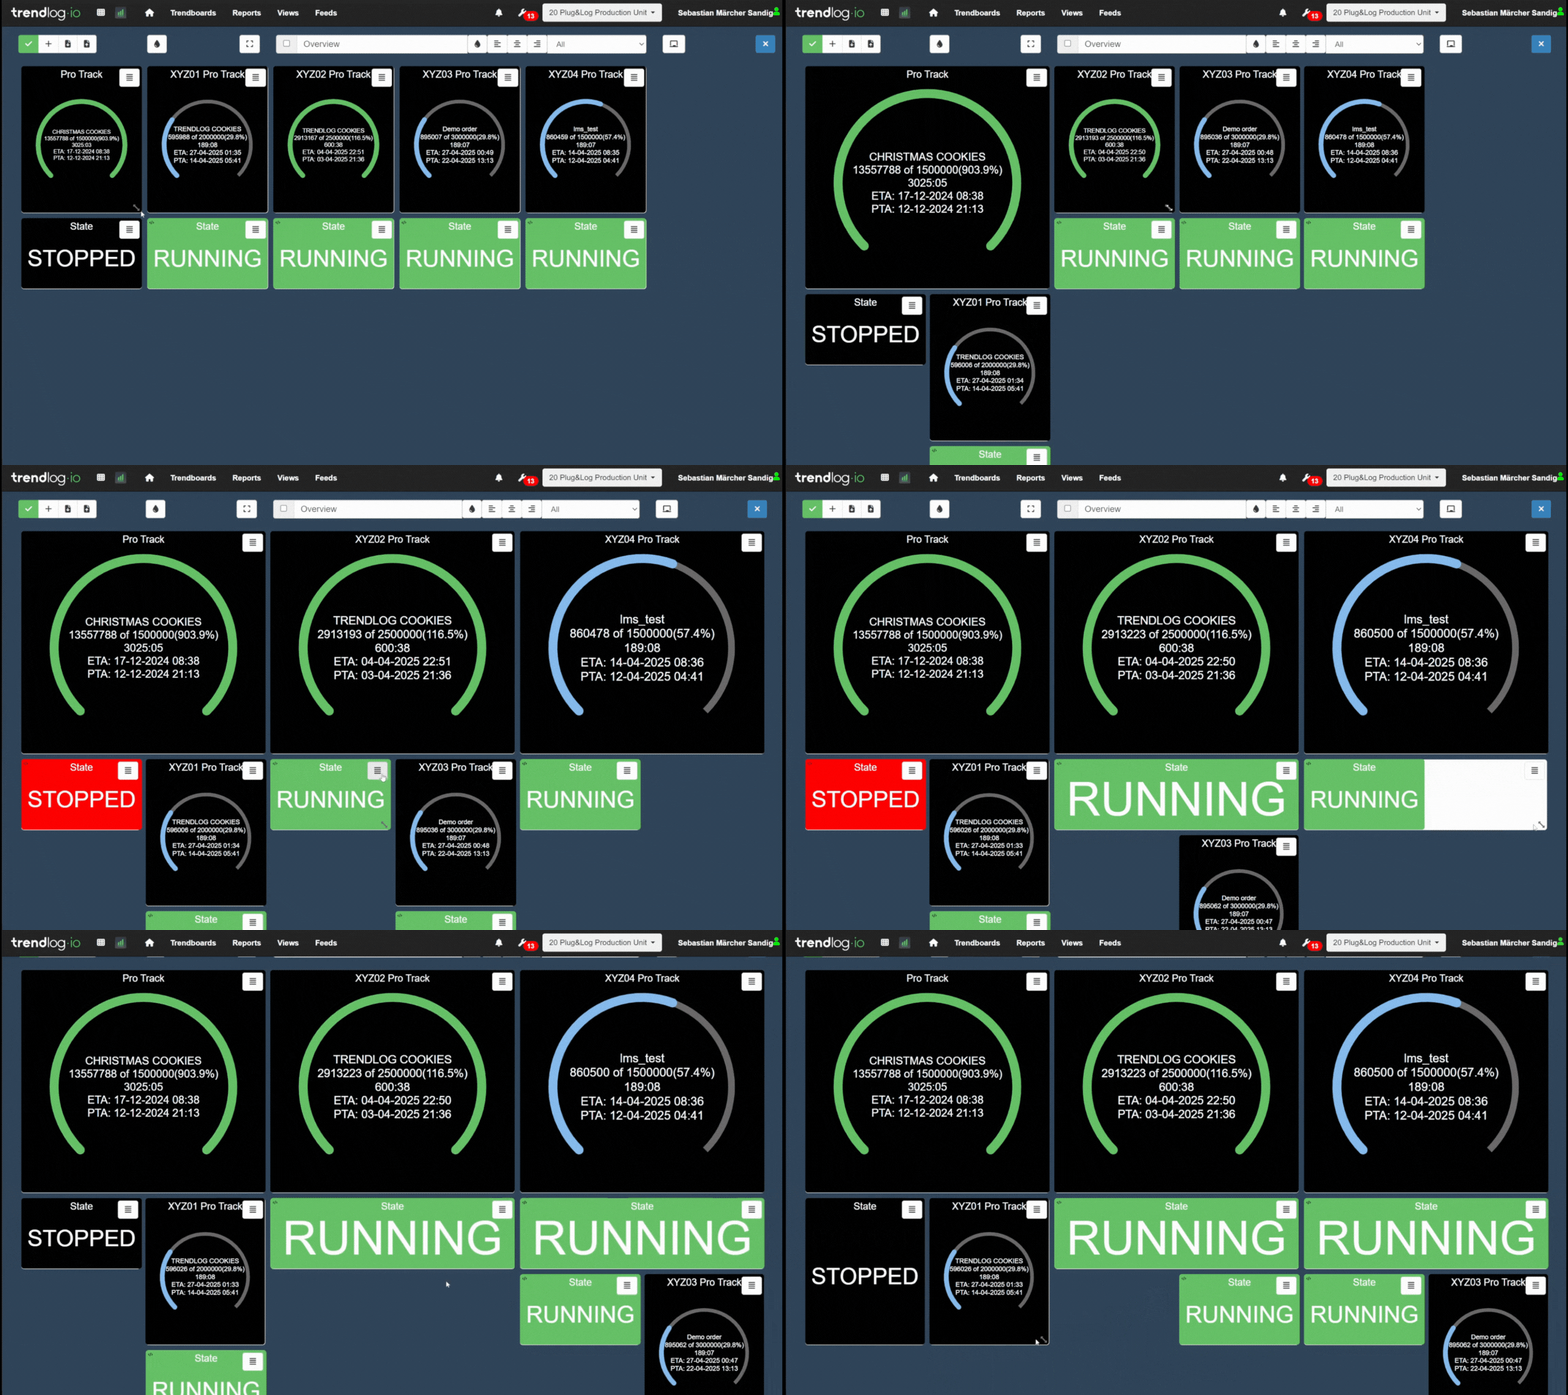
Choose exactly which data you want to see – and how. Trendlog lets you build personalized dashboards with KPIs, graphs, and views that match your needs – whether you’re a production manager, technician, or energy specialist.
Notifications and API
Setting up alerts
Create alerts across your data – for example, on high temperatures, abnormal energy consumption, or extended downtime. With precise thresholds, you can quickly detect issues – and take action before they escalate.
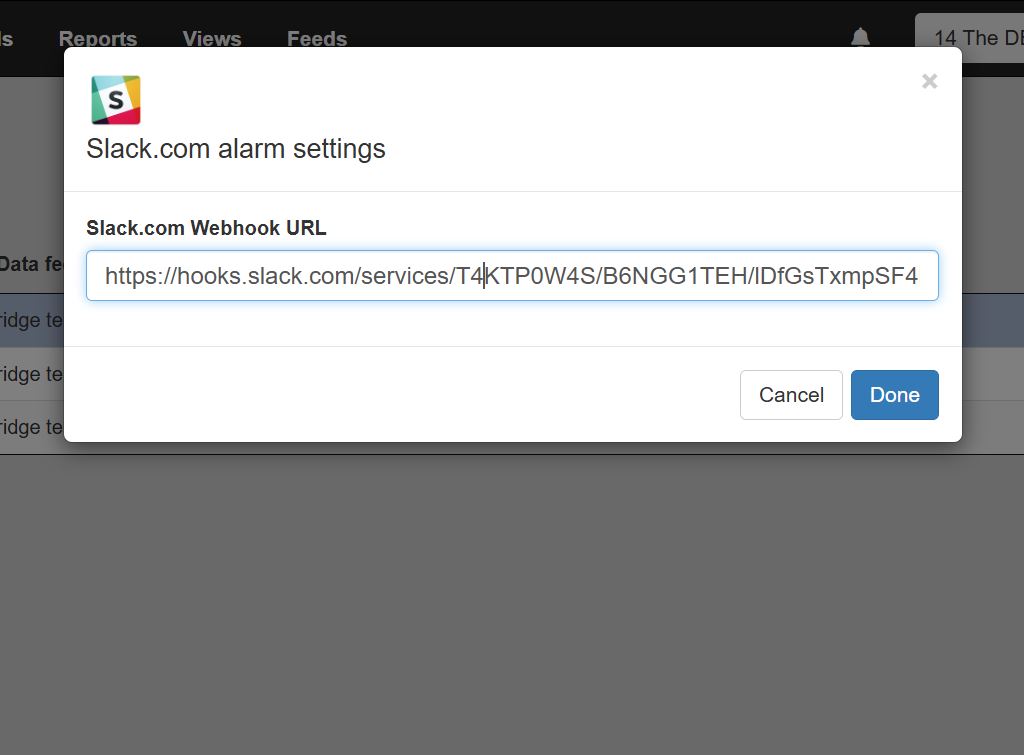
Receive notifications directly by email – or integrate with your own systems via API. That ensures the right person is notified in time, and that your systems always stay up to date with the latest data.


Comment on graphs
Add context to your data
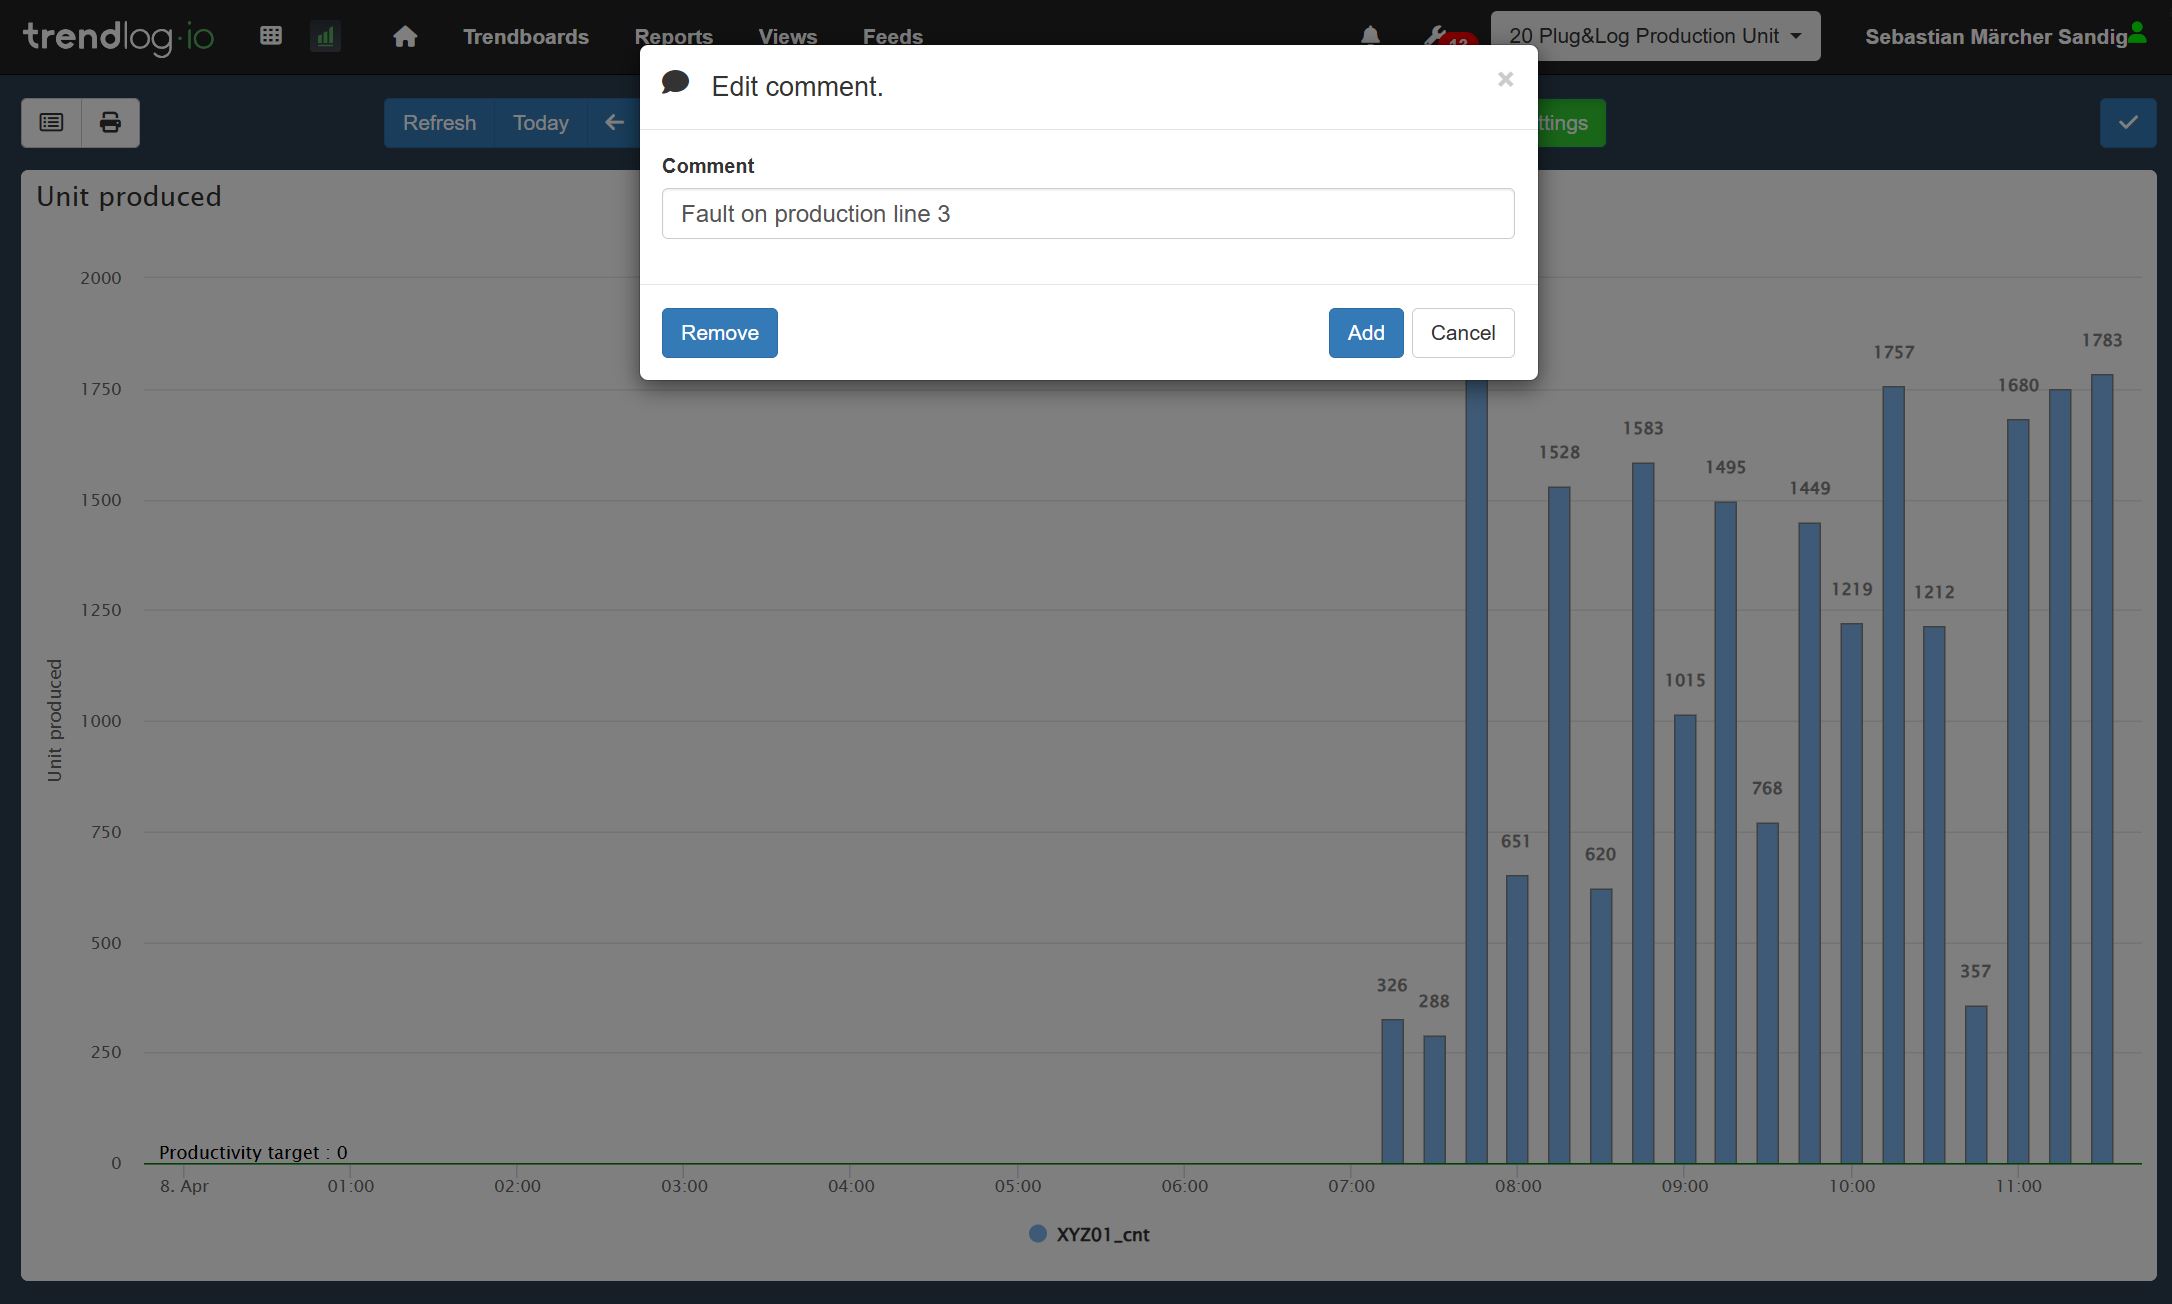
Insert comments directly on graphs and views to explain why a spike or drop occurred. This makes it easy to share knowledge between shifts, document events, and create a shared understanding of your production data.
Frequently Asked Questions
What types of data can we display in dashboards?
You can display production data, energy consumption, maintenance metrics, and quality checks – using real-time graphs, KPIs, and visual widgets.
Can we build separate dashboards for different roles or departments?
Yes – you can fully customize dashboards for each role, such as operators, maintenance teams, quality managers, and executives. Each user sees only what’s relevant to them.
Can we set up alerts and notifications?
Yes – you can define thresholds for temperature, consumption, output, or downtime and get notified by email or via API to Teams, Slack etc. when limits are exceeded.
Can we annotate graphs and add comments?
Yes – you can insert comments directly on dashboards to add context to events, explain deviations, or document actions. This improves shift handovers and collaboration.
Are there any limits to the number of dashboards or users?
No – all Trendlog subscriptions include unlimited users and dashboards, so you can scale as needed across teams and locations.
Take control with data that matters.
Trendlog.io is designed to make production and consumption data useful in your daily operations. With flexible dashboards, smart alerts, and collaborative annotations, it’s easy to work proactively – and improve both efficiency and decision-making.
